IMAGE

Fig 3

ID
ZDB-IMAGE-210313-3
Source
Figures for Cabrera-Quio et al., 2021
Image
Figure Caption

Fig 3 Ski7 modulates the transcriptome during the oocyte-to-embryo transition.

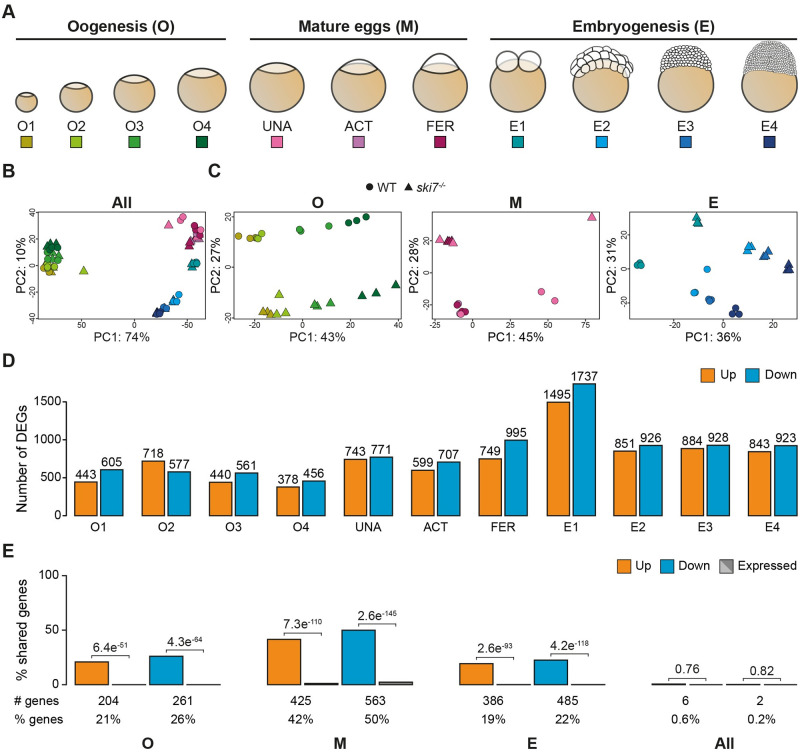
(A) Schematic representation of the stages used for RNA-seq during three consecutive developmental periods: oogenesis, mature eggs and embryogenesis. (B, C) Principal Component Analyses (PCA) of all time points (B) or individual periods (C) used for the polyA+ RNA-seq comparison of WT (circle) and ski7-/- (triangle). (B) Samples show clustering by developmental time. (C) Samples within each period (oogenesis, mature eggs, and embryogenesis) are separated by time and genotype. The colour code corresponds to the different stages from Fig 3A. (D) Differentially expressed genes (DEGs) identified per stage based on polyA+ RNA-Seq data (orange: up-regulated in ski7-/- mutants; blue: down-regulated in ski7-/- mutants). (E) Percentage of shared DEGs (orange: up-regulated; blue: down-regulated) and expression-matched unchanged genes in wild type (gray) per period (oogenesis, eggs, embryogenesis) and during the full time-course (All). P-values from Pearson’s chi-squared test with Yates continuity correction from comparison of the number of up- or down-regulated genes versus expression-matched genes.

Acknowledgments
This image is the copyrighted work of the attributed author or publisher, and ZFIN has permission only to display this image to its users. Additional permissions should be obtained from the applicable author or publisher of the image. Full text @ PLoS Genet.