IMAGE

Fig 1

ID
ZDB-IMAGE-210313-1
Genes
Source
Figures for Cabrera-Quio et al., 2021
Image
Figure Caption

Fig 1 Ski7 mutant fish produce reduced numbers of developing offspring.

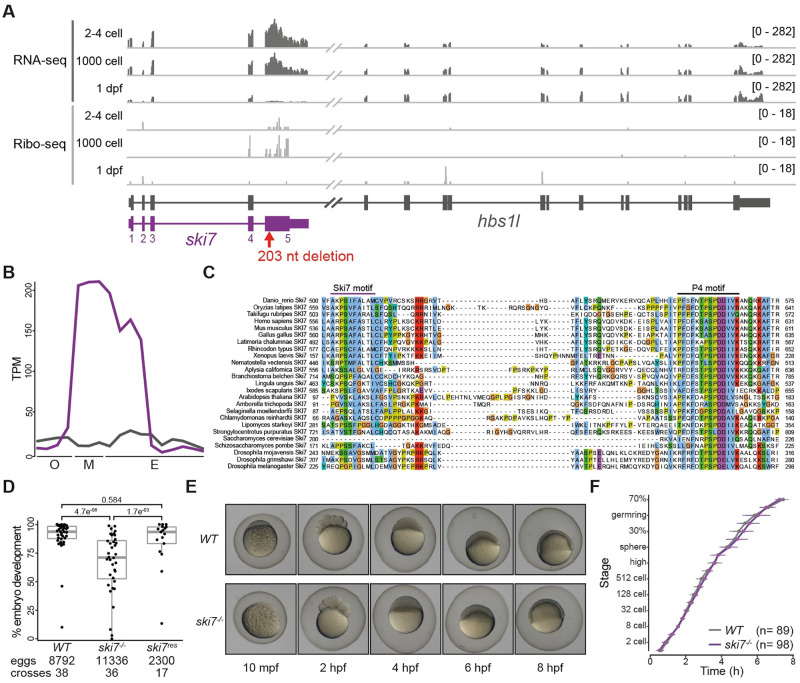
(A) Expression profile of the hbs1l (gray)/ski7 (purple) locus during embryogenesis. Ski7 is highly expressed in the early embryo. RNA-seq is shown in dark gray and Ribo-seq in light gray; numbers in brackets indicate expression levels; the red arrow indicates the site of the ski7 mutation. (B) Ski7 mRNA peaks during the oocyte-to-embryo transition. Transcript-specific quantification of ski7 (purple) and hbs1l (gray) RNA from polyA+ RNA-seq during oogenesis (O: oocyte stages I-IV), in mature eggs (M: unactivated, activated, fertilized) and during embryogenesis (E: 2–4 cell, 256 cell, 1000 cell, oblong, dome, shield, bud, 1 dpf, 2 dpf, 5 dpf [34]); TPM, transcripts per million. (C) Ski7 protein is highly conserved. Protein sequence alignment of the conserved C-terminus of Ski7 across different organisms. The two most conserved motifs, the Ski7-like motif and the Patch (P4)-like motif, are highlighted. (D) Ski7-/- fish produce fewer embryos that develop. Number of embryos that progress beyond the one-cell stage of wild-type (WT), ski7-/- and ski7res (ski7-/-; tg[actb2:ski7-GFP]) fish. Transgenic ski7-GFP rescues the decreased number of viable progeny observed in ski7-/- fish. P-adjusted values from Kruskal-Wallis with Dunn’s multiple comparison test. (E) Ski7-/- embryos develop normally. Representative images of WT and ski7-/- embryos from 10 minutes post-fertilisation (mpf) to 8 hours post-fertilisation (hpf). (F) Quantification of embryo development in WT and ski7-/- embryos. Ski7-/- embryos that undergo cell cleavage develop at normal rate.

Figure Data
Acknowledgments
This image is the copyrighted work of the attributed author or publisher, and ZFIN has permission only to display this image to its users. Additional permissions should be obtained from the applicable author or publisher of the image. Full text @ PLoS Genet.