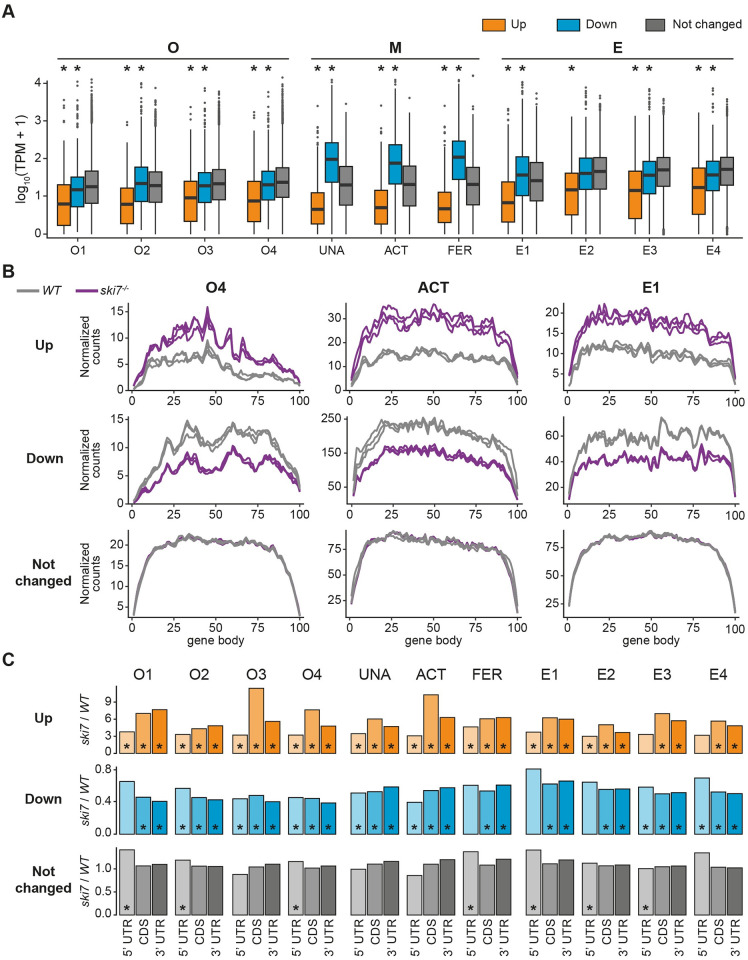
IMAGE

Fig 4

ID
ZDB-IMAGE-210313-4
Source
Figures for Cabrera-Quio et al., 2021
Image
Figure Caption

Fig 4 Genes overexpressed in the <italic>ski7</italic> mutants are lowly expressed.

(A) Genes up-regulated in the absence of Ski7 show low expression levels in wild type. Expression levels of DEGs in wild type for every stage of the time course, as measured by transcripts per million (TPM). * indicates p-value < 0.01 from Wilcoxon test in comparison to unchanged genes. (B) Metagene profiles of up-regulated (top), down-regulated (middle), and unchanged genes (bottom) of wild type and ski7-/- mutants at a representative stage for each period during the oocyte-to-embryo transition (oogenesis = O4, mature eggs = activated eggs, embryogenesis = E1). WT, gray; ski7-/-, purple. (C) Up-regulated genes have higher read density towards their 3’ end. Ratio of read density of ski7-/-/WT per gene body region (5’ UTR, CDS, 3’ UTR) for all stages covered in this study. * p-value < 0.05; Wilcoxon test of read density of ski7-/- vs. read density of WT per region.

Figure Data
Acknowledgments
This image is the copyrighted work of the attributed author or publisher, and ZFIN has permission only to display this image to its users. Additional permissions should be obtained from the applicable author or publisher of the image. Full text @ PLoS Genet.