
- Title
-
Skeletal biology and disease modeling in zebrafish
- Authors
- Dietrich, K., Fiedler, I., Kurzyukova, A., López-Delgado, A.C., McGowan, L., Geurtzen, K., Hammond, C., Busse, B., Knopf, F.
- Source
- Full text @ J. Bone Miner. Res.
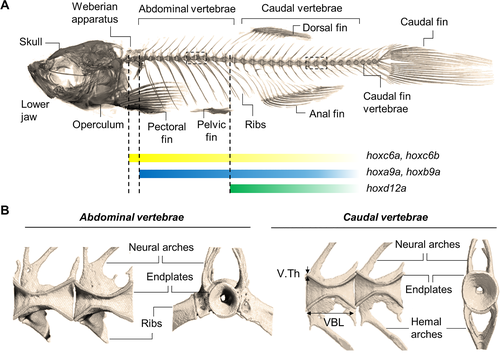
The zebrafish skeleton. (A) μCT image of the craniofacial and axial skeleton, including the vertebral column composed of the Weberian apparatus, abdominal (also referred to as precaudal or thoracic), caudal, and caudal fin vertebrae. Hox gene expression patterns are indicated. Similar to the mammalian skeleton, ribs in zebrafish are articulated to the abdominal vertebrae and protect the inner organs. (B) Close‐up view of abdominal and caudal vertebrae. Sagittal views of two adjacent double‐cone shaped vertebrae (left) display the neural arches extending dorsally and encompassing the neural canal. Extending ventrally from the abdominal vertebrae ribs are articulated, while the caudal vertebrae extend to hemal arches which encompass the caudal artery and vein. In frontal view (right), the unmineralized vertebral center is revealed which contains notochord and vacuolated soft tissue (not displayed). The ring‐shaped vertebral endplate regions are connected by an IVL (not shown) and correspond to the vertebral growth zone in zebrafish. Parameters, including the VBL, V.Th, and BV/TV, provide valuable measures to quantify the vertebral morphology and structure. BV/TV = bone volumetric fraction; IVL = intervertebral ligament; VBL = vertebral body length; V.Th = vertebral thickness. |
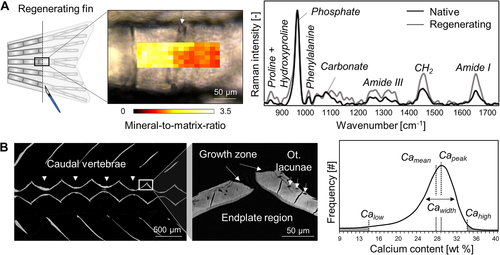
Assessment of matrix composition in zebrafish bone. (A) Raman spectroscopy allows mapping the mineral‐related and protein‐related properties of regenerating caudal fin bone (here, mineral‐to‐matrix ratio at 7 dpa) proximal and distal to the amputation plane (arrow). In the Raman spectra of regenerating parts (gray curve), protein‐related peaks including amide I, amide III, and hydroxyproline, are more pronounced in respect to the mineral‐related phosphate peak, reflecting a lower mineral‐to‐matrix ratio compared to native bone tissue (black curve). (B) qBEI can be used to assess the mineral density distribution in the zebrafish skeleton (here: sagittal plane of the vertebral column and close‐up of the endplate region). A histogram generated from calibrated pixel intensities within a region of interest allows extracting the Camean, Capeak, and Cawidth, as well as areas with Calow and Cahigh. Cahigh = high degree of mineralization; Calow = low degree of mineralization; Camean = mean Ca content; Capeak = peak Ca content; Cawidth = heterogeneity of the Ca distribution; dpa = days post amputation; qBEI = quantitative backscattered electron microscopy. |
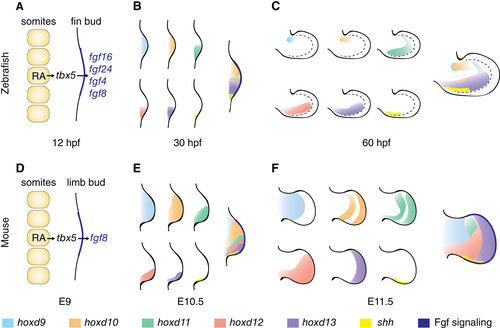
Early patterning of limb and pectoral fin buds is comparable. (A–C) Early zebrafish fin bud patterning. (A) Fin induction at 12 hpf: RA from the somites activates signals that lead to activation of tbx5 in the lateral plate and Fgf signaling in the distal bud, establishing the AER. (B) Early expression of Hox genes and shh at 30 hpf. (C) Expression of Hox genes and shh at 60 hpf. Note that the hoxd11 expression domain in the posterior fin bud region remains restricted to this region at 30 hpf and 60 hpf. Dashed line = boundary of fin bud proper and fin fold. (D–F) Early mouse limb bud patterning. (D) Similar induction signals as described in A for the fin bud occur in the mouse at E9. (E) Early expression of Hox genes and shh in E10.5 mouse limbs shows a similar pattern observed as in B for the fin bud. While hoxd9 and hoxd10 extend through the whole bud, hoxd11, hoxd12, hoxd13, and shh are restricted to the posterior domain. (F) Hox expression domain in E12.5 mouse limbs differs from those observed in C in the fin bud; hoxd11, hoxd12, and hoxd13 domains extend more anteriorly; and shh remains restricted to the posterior region. Left to right = proximodistal axis, top down = anterior–posterior axis. E10.5 = embryonic day 10.5; E12.5 = embryonic day 12.5; E9 = embryonic day 9; hpf = hours post fertilization. |
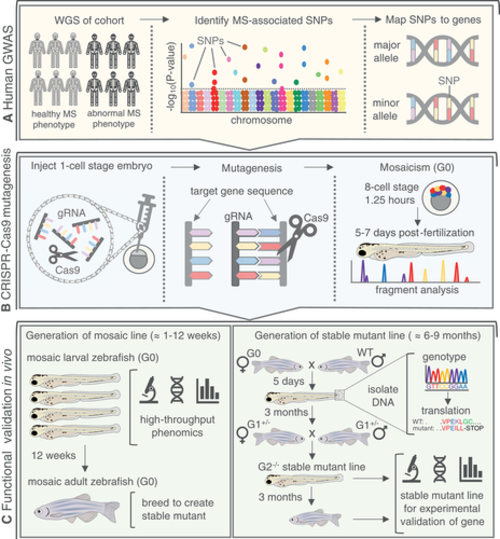
Zebrafish as a tool for rapid validation of GWAS‐derived MS disease‐associated gene candidates. (A) Human GWAS conduct WGS on large cohorts and identify SNP mutations in people with abnormal MS phenotypes. SNPs are then mapped to the nearest gene using whole‐exome sequencing. (B) CRISPR‐Cas9 technology can be used for targeted knockout mutagenesis in vivo. Gene‐specific gRNAs are designed and injected into a one‐cell stage zebrafish embryo with Cas9. Efficient gRNAs will facilitate double‐strand breaks within an exon in the target gene, resulting in indel mutations. A mosaic (G0) embryo (crispant) will develop, containing a variety of mutant and WT alleles for the gene of interest that are validated through fragment analysis. (C) (Left) mosaic larval zebrafish can be rapidly screened for MS phenotypes during skeletogenesis, providing a high‐throughput and efficient phenomics‐based approach to gene validation. Mosaic G0 zebrafish can be raised to adulthood for breeding into a stable line with a single, known mutant allele. (Right) G0 mosaic zebrafish are crossed to WT. Resulting heterozygous larvae (G1+/−) are fin‐clipped to isolate DNA for genotyping and in silico translation to identify alleles resulting in a premature STOP codon, compromising the protein. G1+/− with the same mutant allele are bred with each other to generate the G2−/− line with a stable mutation in the gene of interest. The stable mutant larvae or adults can then be used for experimental validation of the MS‐associated phenotype. gRNA = guide RNA; hpf = hours post fertilization; MS = musculoskeletal; SNP = single‐nucleotide polymorphism; WGS = whole‐genome sequencing; WT = wild‐type. |
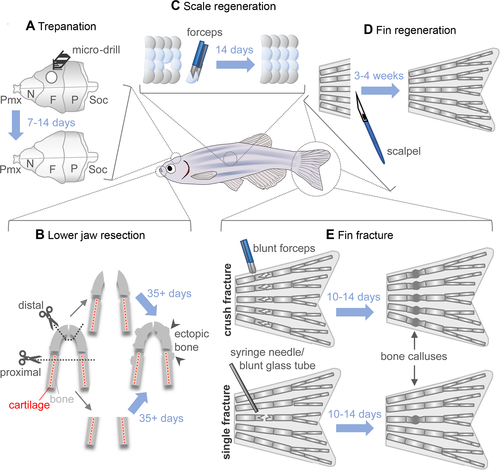
Models of bone repair and regeneration in adult zebrafish. (A) During skull trepanation, a microdrill is used to destroy bone from the os frontale, which regenerates within 7 to 14 days. (B) Two models of lower jaw resection can be performed: proximal, where both cartilage and bone are removed posterior to the synovial joint using surgical scissors (dotted line), and distal, where only the most anterior part of the bone is removed. Regeneration post resection takes upwards of 35 days and leads to ectopic bone formation in the regenerate. (C) Scale plucking with forceps is a simple method for studying bone regeneration in vivo. Scales can be cultured ex vivo and bone regeneration easily studied dynamically in vivo due to the superficial nature of the injury. (D) Due to its accessibility and the presence of lepidotrichia (bony fin rays), the caudal fin is an excellent model for studying bone regeneration and repair. Epimorphic fin regeneration after amputation requires 3 to 4 weeks until completion. (E) Fin ray fractures are bridged in 10 to 14 days and result in a bone callus, which is then remodeled. Two fin ray fracture models are available: in the crush‐fracture model (top), forceps are used to introduce fractures along the entire width of the fin. In the single‐fracture model, either a syringe needle or blunt glass capillary tube is used to press on an individual bone segment, introducing a single fracture in one or both hemirays. F = os frontale; N = os nasale; P = os parietale; Pmx = os praemaxillare; Soc = os supraoccipitale. |
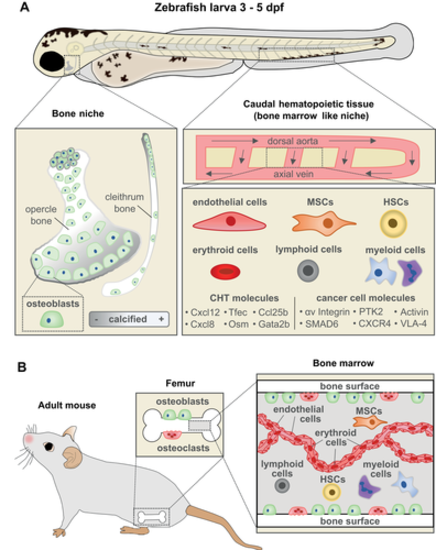
The CHT as an attractive site to study bone metastasis (A) Zebrafish larvae at 3 to 5 dpf contain developing bone (opercle and cleithrum) and CHT which acts as a BM‐like niche. (Left) The opercle and cleithrum are among the first dermal bones to develop and can be imaged in live larvae due to their lateral, superficial positioning. (Right) The CHT is located laterally to the dorsal aorta in the posterior region of the larval zebrafish and is the site of early hematopoiesis, akin to mammalian BM. The cellular components of the CHT include endothelial cells, MSCs, HSCs, myeloid cells such as macrophages and neutrophils, lymphoid cells, and erythroid cells. Molecular components of the CHT listed have been previously shown to play a role in bone metastasis in mammalian models. Metastasis‐related factors expressed in cancer cells uncovered in this model are shown on the right. (B) Illustration of the BM niche in a mouse long bone containing similar cell types as the CHT. dpf = days post fertilization; MSCs = mesenchymal stromal cells; HSCs = hematopoietic stem cells. |