
- Title
-
Reoccurring neural stem cell divisions in the adult zebrafish telencephalon are sufficient for the emergence of aggregated spatiotemporal patterns
- Authors
- Lupperger, V., Marr, C., Chapouton, P.
- Source
- Full text @ PLoS Biol.
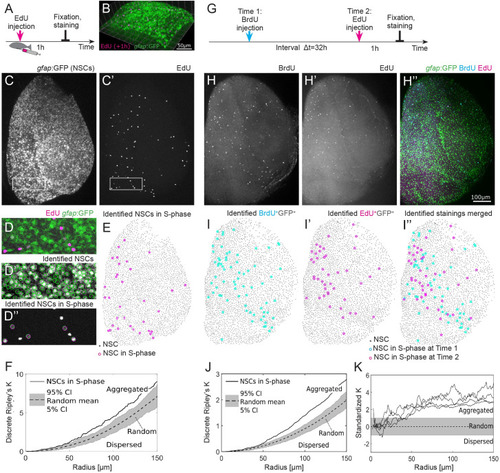
(A) Experimental setup: EdU is injected intraperitoneally 1 h prior to humanely killing the fish and fixation of the brain. (B) Part of the telencephalic hemisphere as a 3D reconstruction. The |
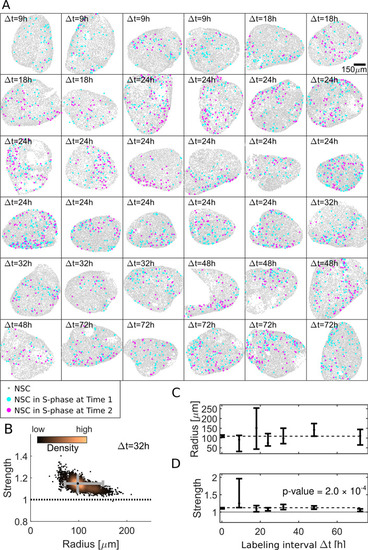
(A) Our dataset comprises 36 hemispheres with labeling intervals from Δt = 9 h to 72 h. (B) Posterior sampling identifies the most likely interaction strength of 1.15 and most likely interaction radius of 98 μm for 4 Δt = 32 h hemispheres. Whiskers (gray) cover the 95% CIs for strength and radius. Sampling point density is visualized from copper (high) to black (low). (C) Applied to all 36 hemispheres posterior sampling reveals an interaction radius around 100 μm. (D) The interaction strength is significantly above 1 for all labeling intervals Δt ( |
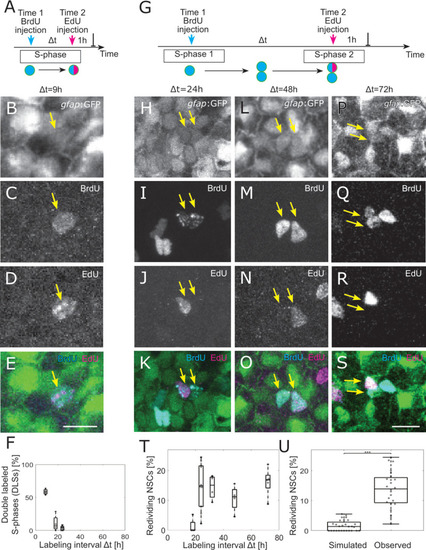
(A) The 2 injections label the same cells in S-phase for small-labeling intervals, leading to NSCs that are both EdU and BrdU positive, denoted as double-labeled S-phase (DLS). (B–E) Example DLS (yellow arrow) for a labeling interval Δt = 9 h. (F) The DLS proportion is high for Δt = 9 h and decreases rapidly with increasing Δt. Each dot represents the value for 1 brain hemisphere. (G) After a division, 1 of the daughter cells already labeled by the Time 1 label can enter in a new S-phase and incorporate a second label. This cell thereby redivides. (H–S) Three examples of redividing NSCs with labeling intervals of 24 h (H–K), 48 h (L–O), and 72 h (P–S). Scale bar: 10 μm. (T) The proportions of redividing NSCs within the dividing NSCs at Time 1 remain high from Δt = 24 h to Δt = 72 h labeling intervals. Each dot represents 1 brain hemisphere. (U) Only 1.9±1.7% of randomly drawn divisions (same amount as observed per hemisphere) from all NSCs would be redrawn at random, while 14±8% of observed NSCs in S-phase reenter S-phase ( |
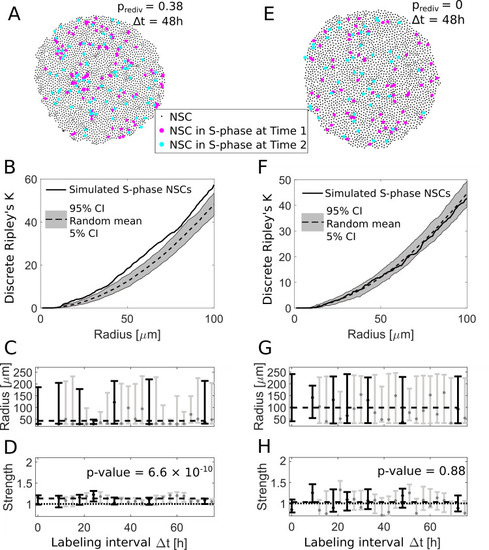
(A) We use an agent-based model to simulate NSC divisions with a redivision probability of prediv = 0.38 and perform virtual measurements with labeling intervals Δt between 9 h and 72 h (here shown for Δt = 48 h). (B) The simulated NSCs in S-phase in (A) exhibit an aggregated spatiotemporal pattern according to the discrete Ripley’s K curve (solid line) which is above the 90% CI of randomly sampled patterns (gray area), similar to experimentally observed patterns. (C) The fitted radii for simulations with redividing NSCs for different labeling intervals Δt are variable with a maximum likelihood value of 50 μm. Labeling intervals that are also available from experimental data (see |