
Fig 3
- ID
- ZDB-IMAGE-210106-3
- Publication
- Lupperger et al., 2020 - Reoccurring neural stem cell divisions in the adult zebrafish telencephalon are sufficient for the emergence of aggregated spatiotemporal patterns
- All Figures
- Figures for Lupperger et al., 2020
|
Fig 3
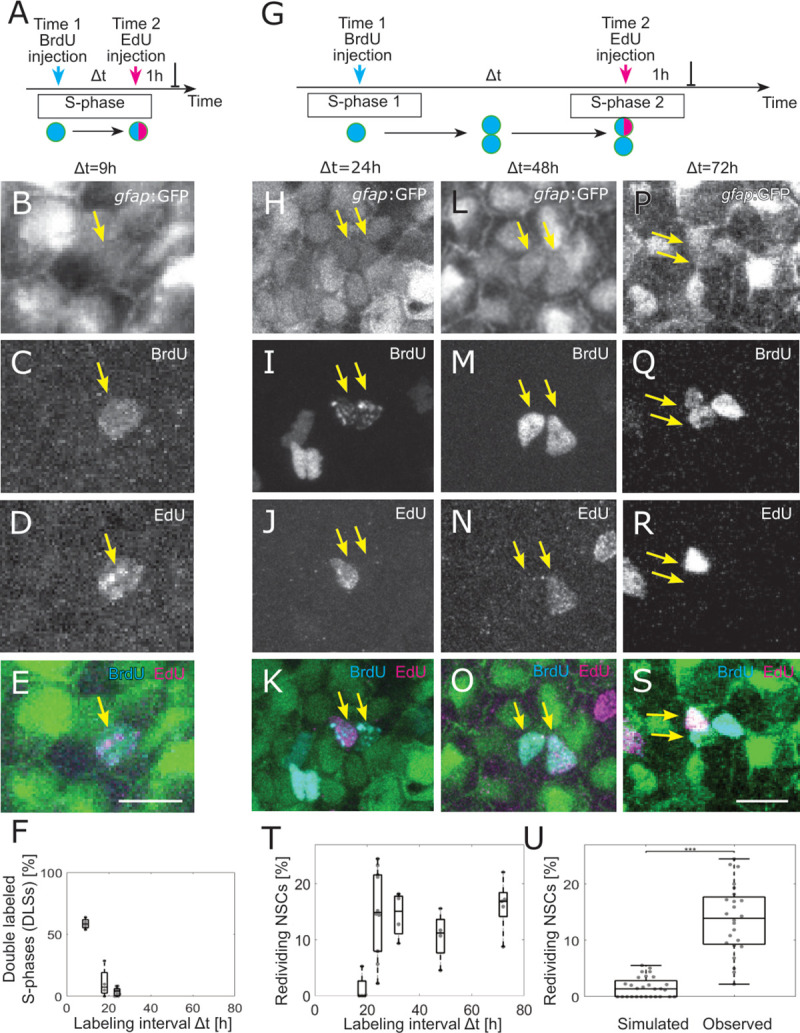
(A) The 2 injections label the same cells in S-phase for small-labeling intervals, leading to NSCs that are both EdU and BrdU positive, denoted as double-labeled S-phase (DLS). (B–E) Example DLS (yellow arrow) for a labeling interval Δt = 9 h. (F) The DLS proportion is high for Δt = 9 h and decreases rapidly with increasing Δt. Each dot represents the value for 1 brain hemisphere. (G) After a division, 1 of the daughter cells already labeled by the Time 1 label can enter in a new S-phase and incorporate a second label. This cell thereby redivides. (H–S) Three examples of redividing NSCs with labeling intervals of 24 h (H–K), 48 h (L–O), and 72 h (P–S). Scale bar: 10 μm. (T) The proportions of redividing NSCs within the dividing NSCs at Time 1 remain high from Δt = 24 h to Δt = 72 h labeling intervals. Each dot represents 1 brain hemisphere. (U) Only 1.9±1.7% of randomly drawn divisions (same amount as observed per hemisphere) from all NSCs would be redrawn at random, while 14±8% of observed NSCs in S-phase reenter S-phase (