IMAGE

Fig 4

ID
ZDB-IMAGE-210106-4
Source
Figures for Lupperger et al., 2020
Image
Figure Caption

Fig 4 An agent based redivision model can explain spatial aggregation of NSCs in S-phase.

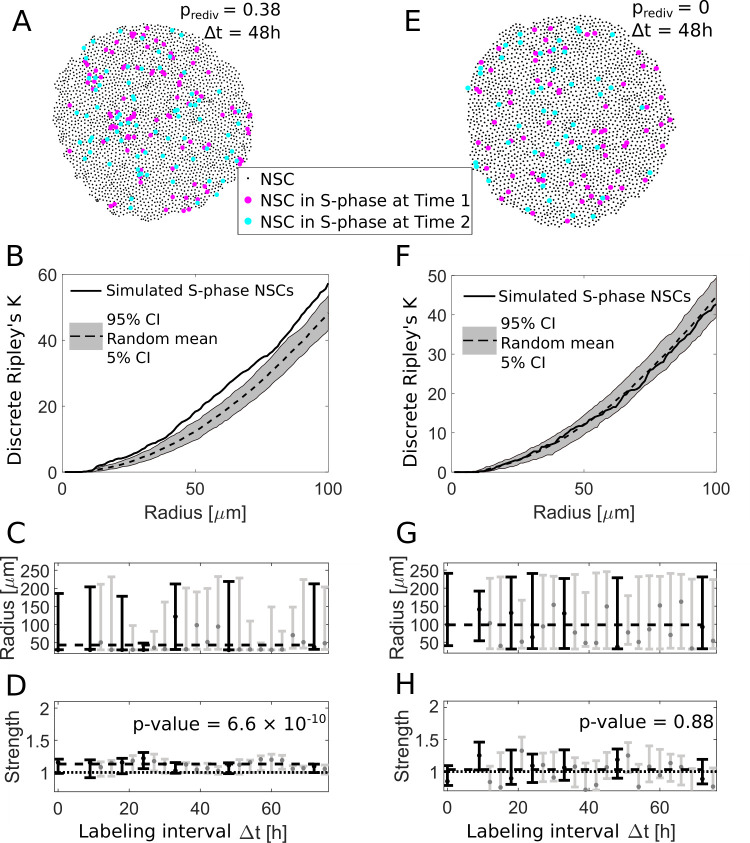
(A) We use an agent-based model to simulate NSC divisions with a redivision probability of prediv = 0.38 and perform virtual measurements with labeling intervals Δt between 9 h and 72 h (here shown for Δt = 48 h). (B) The simulated NSCs in S-phase in (A) exhibit an aggregated spatiotemporal pattern according to the discrete Ripley’s K curve (solid line) which is above the 90% CI of randomly sampled patterns (gray area), similar to experimentally observed patterns. (C) The fitted radii for simulations with redividing NSCs for different labeling intervals Δt are variable with a maximum likelihood value of 50 μm. Labeling intervals that are also available from experimental data (see Fig 2C) are shown in black, all others in gray. (D) The respective fitted strengths values are above 1 indicating aggregated patterns. Fitting a constant model to the most likely values with the same Δt as experimentally observed (black bars) reveals a significant shift (p-value = 6.6 × 10⁻¹⁰) from a strength of 1. Labeling intervals that are also available from experimental data (see Fig 2D) are shown in black, all others in gray. (E) Simulated NSC divisions and virtual measurements with a redivision probability prediv = 0 at 2 labelings Δt = 48 h apart. (F) Without redivisions, the simulated S-phase NSCs are within the boundaries of random patterns. (G) The fitted radii are highly variable with maximum likely values from 50 to 150 μm. Labeling intervals that are also available from experimental data (see Fig 2C) are shown in black, all others in gray. (H) In contrast to the simulations with redivisions, we now find no indication for aggregated patterns for all labeling intervals (p-value = 0.88 for a constant model with nonzero shift from a strength of 1). Labeling intervals that are also available from experimental data (see Fig 2D) are shown in black, all others in gray. CI, confidence interval; NSC, neural stem cell.

Acknowledgments
This image is the copyrighted work of the attributed author or publisher, and ZFIN has permission only to display this image to its users. Additional permissions should be obtained from the applicable author or publisher of the image. Full text @ PLoS Biol.