|
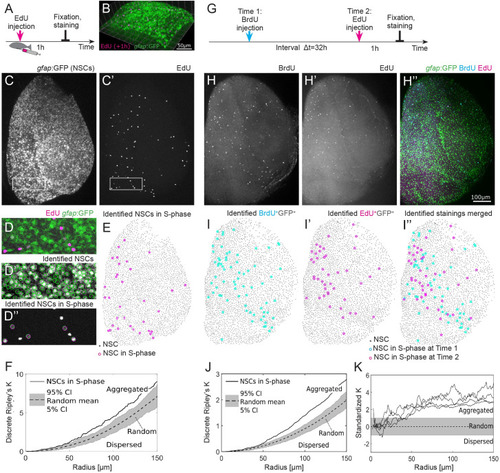
S-phases occurring in the NSC population are spatiotemporally aggregated.(A) Experimental setup: EdU is injected intraperitoneally 1 h prior to humanely killing the fish and fixation of the brain. (B) Part of the telencephalic hemisphere as a 3D reconstruction. The gfap:GFP transgene highlights cell bodies of NSCs, which are arranged on a 2D layer on the telencephalon surface, while their radial processes project deep in the parenchyme. (C, C’) gfap:GFP in the whole hemisphere shown as a maximum intensity z-stack projection, anterior to the top, lateral to the right, and medial to the left. Boxed areas are shown as higher magnifications in (D–D”). (C’) EdU coupled to Azyde-Alexa 647 highlights cells in S-phase and reveals their spatial distribution. (D) Merged GFP and EdU channel to identify specifically the NSCs in S-phase. (D’) Automatically identified NSCs surrounded by green circles. (D”) EdU+ cells were subdivided into EdU+gfap:GFP− and EdU+gfap:GFP+, the latter representing NSCs in S-phase. (E) The 33 NSCs in S-phase (pink circles) exhibit a nonrandom spatial pattern on top of all 2678 NSCs (gray dots). (F) Discrete Ripley’s K quantification of the pattern shown in (E) reveals that NSCs in S-phase (solid line) are aggregated, i.e., closer to each other than expected from random (dotted line with 90% CI in gray) and dispersed patterns. (G) Cells in S-phase are labeled with BrdU and EdU with an interval of 32 h. Fish are humanely killed 1 h after the EdU injection, and the brains are imaged after fixation and staining. (H–H”) Example of 1 telencephalic hemisphere, oriented as in (C), as a maximum intensity z-stack projection, in 3 different channels: BrdU (H), EdU (H’), and gfap:GFP transgene highlighting NSC bodies merged with the EdU and BrdU staining (H”). Scale bar: 100 μm. (I–I”) Identified NSCs in S-phase at 2 different time points exhibit aggregated spatiotemporal patterns. (J) Discrete Ripley’s K reveals more EdU+ NSCs around BrdU+ NSCs as expected from a random process. (K) We find spatiotemporally aggregated patterns with radii above 50 μm in all 4 hemispheres where S-phases have been labeled with a labeling interval of 32 h. BrdU, 5-bromo-2′-deoxyuridine; CI, confidence interval; EdU, 5-Ethynyl-2′-deoxyuridine; GFP, green fluorescent protein; NSC, neural stem cell.
|