
Fig 2
- ID
- ZDB-IMAGE-210106-1
- Publication
- Lupperger et al., 2020 - Reoccurring neural stem cell divisions in the adult zebrafish telencephalon are sufficient for the emergence of aggregated spatiotemporal patterns
- All Figures
- Figures for Lupperger et al., 2020
|
Fig 2
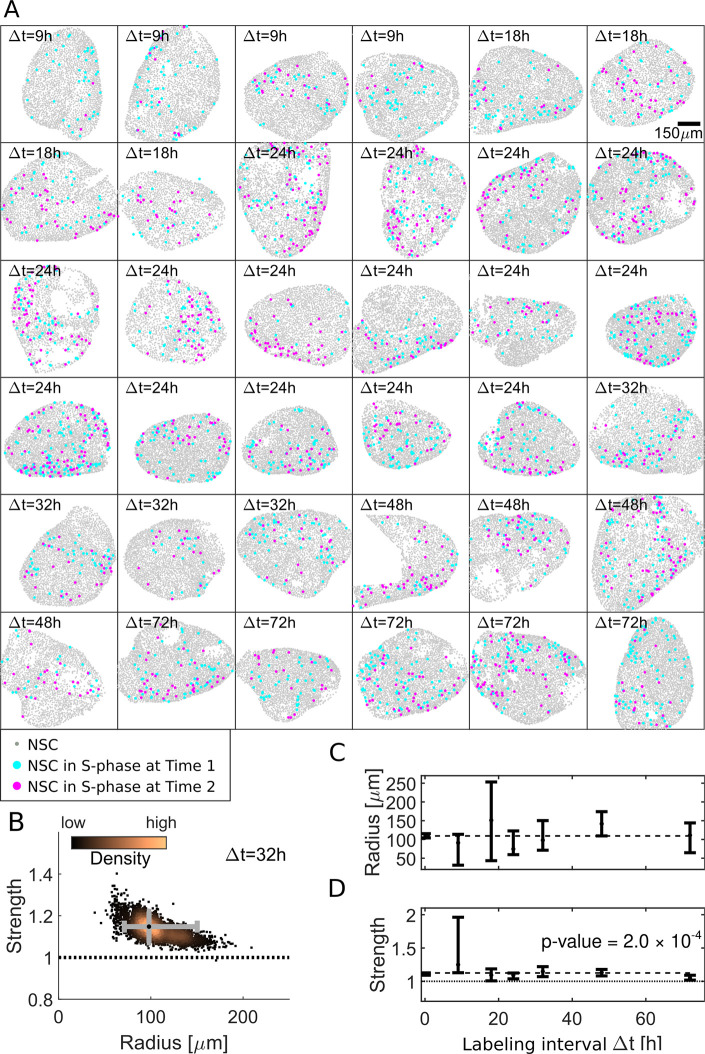
(A) Our dataset comprises 36 hemispheres with labeling intervals from Δt = 9 h to 72 h. (B) Posterior sampling identifies the most likely interaction strength of 1.15 and most likely interaction radius of 98 μm for 4 Δt = 32 h hemispheres. Whiskers (gray) cover the 95% CIs for strength and radius. Sampling point density is visualized from copper (high) to black (low). (C) Applied to all 36 hemispheres posterior sampling reveals an interaction radius around 100 μm. (D) The interaction strength is significantly above 1 for all labeling intervals Δt (