Distribution pattern of the mesenchymal cells in larval fins. (A) Image of the whole body and (B) the median fin fold of the transgenic (TG) larva expressing Lifeact-mCherry under the 5xand1(MC) promoter. The white dot line shows the outline of median fin fold. (B) Localization pattern of mesenchymal cells (expressing Lifeact-mCherry: magenta) and actinotrichia (labeled by And1-GFP: green) in the larval fin. (B′) Magnified image of the white box in (B). Transverse section image of the white dotted line is shown in the right panel. Actin-rich pseudopodia interact with actinotrichia (white arrowheads). (C) Image of the whole body and (D) the median fin fold of TG larva expressing mCherry-CaaX under the and1(BK) promoter. The white dotted line shows the outline of the median fin fold. (D) Localization pattern of basal keratinocytes (expressing mCherry-CaaX: magenta) and actinotrichia (labeled by And1-GFP: green) in the larval fin. (D′) The magnified image of white box in (D). Transverse section image at the white dotted line is shown in the right panel. All larvae were at the stage of 3 dpf. MC, mesenchymal cell specific promoter designated as 2PΔepi in the previous paper (Lalonde et al., 2016); BK, basal keratinocyte specific promoter designated as 1.4 k and1 pro in the previous paper (Kuroda et al., 2018). Scale bars: 500 μm in (A,C), 50 μm in (B,D).

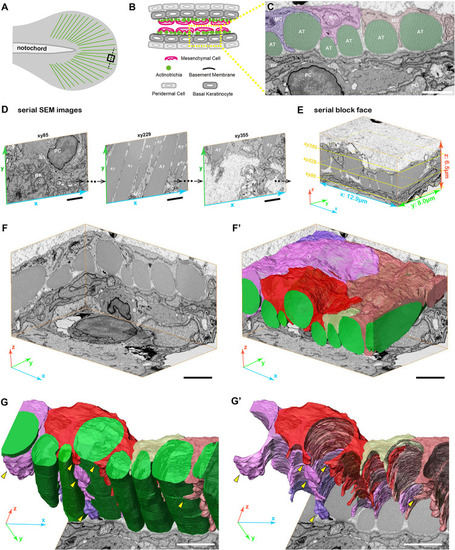
3D reconstruction of fin mesenchymal cells and actinotrichia by FIB-SEM analysis. (A) Illustration of the 3 dpf larval median fin. Black boxed region (15 μm × 15 μm) in the fin tip was used for the FIB-SEM analysis. (B) Schematic diagram of the transverse section of the black dotted line in (A) at the fin tip. Actinotrichia are distributed inside the basement membrane. (C) An example of SEM image of the transverse section at the fin tip. Mesenchymal cells (shown in purple, pink, and orange color) develop the long pseudopodia structures and directly interact with actinotrichia (shown in green color). (D) Serial SEM images at x-y- plane obtained by FIB-SEM observation. (E) Three-dimensional view of the serial block surface image, 12.9 μm × 8.0 μm × 6.5 μm. The positions of each SEM images in (D) are shown in the yellow boxes. (F) Three-dimensional view of the reconstructed sequential SEM images and (F′) the 3D reconstruction of eight actinotrichia (labeled by green color) and five mesenchymal cell domains (labeled by purple, pink, red, yellow, and orange color). (G) 3D reconstruction of actinotrichia and mesenchymal cell domains and (G′) 3D reconstruction of mesenchymal cell domains viewed from the epidermal cell layer. Multiple pseudopodia structures are developed from each mesenchymal cell domains and hold actinotrichia fibrils (yellow arrowheads). MC, mesenchymal cell; AT, actinotrichia; BK, basal keratinocyte; PC, peridermal cell. Scale bars: 2 μm.

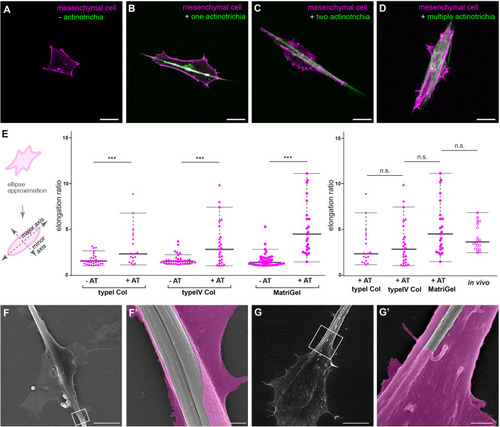
Interaction between mesenchymal cells and actinotrichia in vitro.(A–D) The morphology of primary cultured mesenchymal cells at day 2 after culture on a Matrigel-coated dish. Mesenchymal cells and actinotrichia were isolated from TG larval fins [TG; 5xand1(MC]: Lifeact-mCherry/5xand1(2P): And1full-GFP). (A) In the condition without actinotrichia, mesenchymal cells showed the symmetric morphology. (B–D) In the condition with actinotrichia, mesenchymal cells elongated along a single actinotrichia (B), two actinotrichia (C) and multiple actinotrichia (D). (E) Cell aspect ratio of mesenchymal cells. Mesenchymal cells in contact with actinotrichia had a more elongated shape compared to the cells not in contact with actinotrichia. (F–G′) SEM images of cultured mesenchymal cells holding the actinotrichia on a Matrigel-coated dish. The actinotrichia was surrounded with the plasma membrane of the mesenchymal cell (F) and partially embedded inside the mesenchymal cell (G). The magnified images in white box are shown. P-values: ***P < 0.0001. AT, actinotrichia. Scale bars: 20 μm in (A–D), 10 μm in (F,G), 1 μm in (F′,G′).

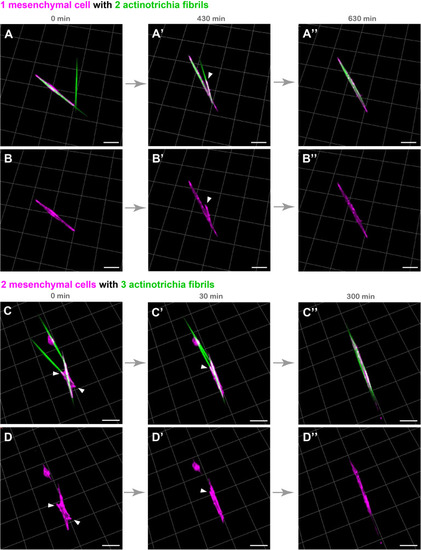
Live cell imaging of cultured mesenchymal cells holding the actinotrichia fibrils. Captured time-lapse images for the interaction between mesenchymal cells and actinotrichia fibrils. Mesenchymal cells and actinotrichia were isolated from the fins of F1 TG larvae [TG; 5xand1(MC): Lifeact-mCherry/5xand1(2P): And1full-GFP] and cultured on a Matrigel-coated dish. (A) A single mesenchymal cell initially surrounded one of two different actinotrichia fibrils. (A′) At 430 min, the mesenchymal cell started to develop a filopodia like structure (white arrowheads) and to hold another fibril. Finally, (A′′) at 630 min, two fibrils were completely aligned in the direction of the longitudinal axis of the mesenchymal cell. The fluorescence images of only a mesenchymal cell are shown in the bottom panels (B–B′′). (C) Two mesenchymal cells initially developed their pseudopodia (white arrowheads) and attached to three different fibrils, and (C′) gradually changed their morphology and moved the fibrils. (C′′) At 300 min, the two cells extended in the same direction and all of three fibrils were oriented along the longitudinal axis of the two mesenchymal cells. The fluorescence images of only two mesenchymal cells are shown in bottom panels (D–D′′). Scale bars: 20 μm.

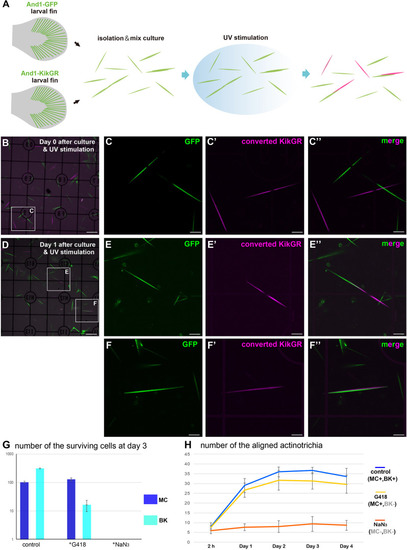
Mesenchymal cells are essential for the in vitro alignment of actinotrichia. (A) Illustration of the procedure for the in vitro mix culture experiment. Actinotrichia and cells were harvested from two different TG larval fins (TG; and1 1.4k: And1-GFP, and1 1.4k: And1-KikGR) and cultured on a Matrigel-coated dish. The isolated actinotrichia were stimulated by UV radiation in vitro and the aligned actinotrichia composed of fibrils labeled by two different fluorescent proteins were counted. (B) The fluorescence image at Day 0 (after 2 h of culture and UV stimulation). (C–C′′) Magnified images of the white box in (B). (D) The fluorescence image at Day 1 after culture and UV stimulation. (E–E′′) Magnified images of the white box in (D). Two actinotrichia were connected tip-to-tip and their orientation was aligned. (F–F′′) Magnified images of the white box in (D). Two actinotrichia were connected with side-to-side and their orientation was aligned. (G) Number of the surviving mesenchymal cells and basal keratinocytes under the control, G418 (200 μg/ml)-treated condition and NaN3 (0.1%)-treated condition. (H) The aligned actinotrichia were increased in the G418-treated condition (only mesenchymal cells alive) but not in the NaN3-treated condition (cell-free state). MC, mesenchymal cell; BK, basal keratinocyte. Scale bars: 100 μm in (B,D), 20 μm in (C-C′′,E-E′′,F-F′′).

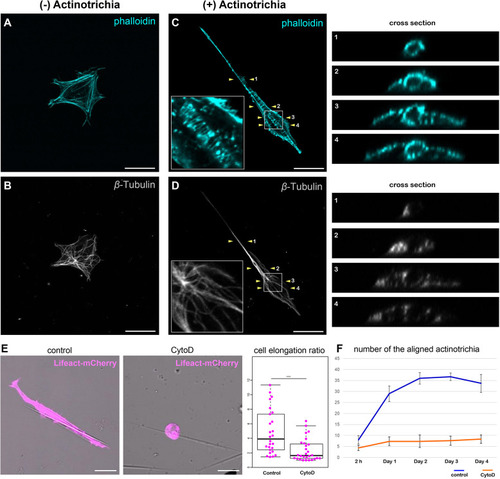
Inhibition of actin polymerization suppressed the orientation formation of actinotrichia. (A,B) A cultured mesenchymal cell without contact with actinotrichia was stained with phalloidin and anti-β-Tubulin antibodies. (A) Image of phalloidin staining and (B) anti-β-Tubulin antibody staining. Actin-rich fibers were detected below the plasma membrane and actin-rich filopodia structures were developed at the cell edge (A). β-Tubulin localization was observed radially from the center of the cell (B). (C,D) A cultured mesenchymal cell in contact with a single actinotrichia was stained with phalloidin and anti-β-Tubulin antibodies. The ortho-slice images between two yellow arrowheads are showed in the right panels and the magnified images of the white box are inset. (C) The image of phalloidin staining and (D) anti-β-Tubulin antibody staining. Strong accumulation of actin was detected around the actinotrichia. On the contrary, β-Tubulin localization was observed radially from the center of the cell and was not detected around the actinotrichia. (E) The morphology of the cultured mesenchymal cells at day 2 after culture under control and CytoD-treated conditions. The mesenchymal cells treated with CytoD tended to be unable to elongate along the actinotrichia axis. The elongation ratio of the CytoD treated cells is much lower than that of the control cells. (F) The number of aligned actinotrichia did not increased under the CytoD-treated condition. P-values: ***P < 0.001. Scale bars: 20 μm.

Suppression of actin polymerization in mesenchymal cells induced the collapse of the actinotrichia distribution in vivo. The distribution pattern of the actinotrichia and the nuclei of mesenchymal cells in the TG larva (3 dpf) expressing the wild-type RhoA(A) or dominant negative form of RhoA(B) in mesenchymal cells. The actinotrichia and nuclei of mesenchymal cells were visualized by And1full-GFP (green) and H2B-mRFP (magenta) respectively. (A′,A′′) The magnified images of the white box in (A). (A′) Nuclei of mesenchymal cells and (A′′) nuclei of mesenchymal cells and actinotrichia are shown. The transverse section image at the white dot line in (A′′) is shown at the lower panel. (B′,B′′) The magnified images of the white box in (B). (B′) Nuclei of mesenchymal cells and (B′′) nuclei of mesenchymal cells and actinotrichia are shown. The transverse section image at the white dot line in (B′′) is shown at the lower panel. Aberrant actinotrichia were distributed in a space between the two actinotrichia layers (white arrowhead). (C) The nucleus elongation ratio in mesenchymal cells expressing RhoADN is much lower than that in the control. The nucleus direction of mesenchymal cells in control larvae showed a radial distribution pattern, whereas, it was randomized in the larvae overexpressing RhoADN. The nucleus of mesenchymal cells in the ventral-mid area of median fins were measured. P-values: ***P < 0.0001. Scale bars: 50 μm in (A,B), 20 μm in (A′,A′′,B′,B′′).

Acknowledgments
This image is the copyrighted work of the attributed author or publisher, and ZFIN has permission only to display this image to its users. Additional permissions should be obtained from the applicable author or publisher of the image. Full text @ Front Cell Dev Biol