IMAGE

FIGURE 6

ID
ZDB-IMAGE-201121-46
Source
Figures for Kuroda et al., 2020
Image
Figure Caption

FIGURE 6

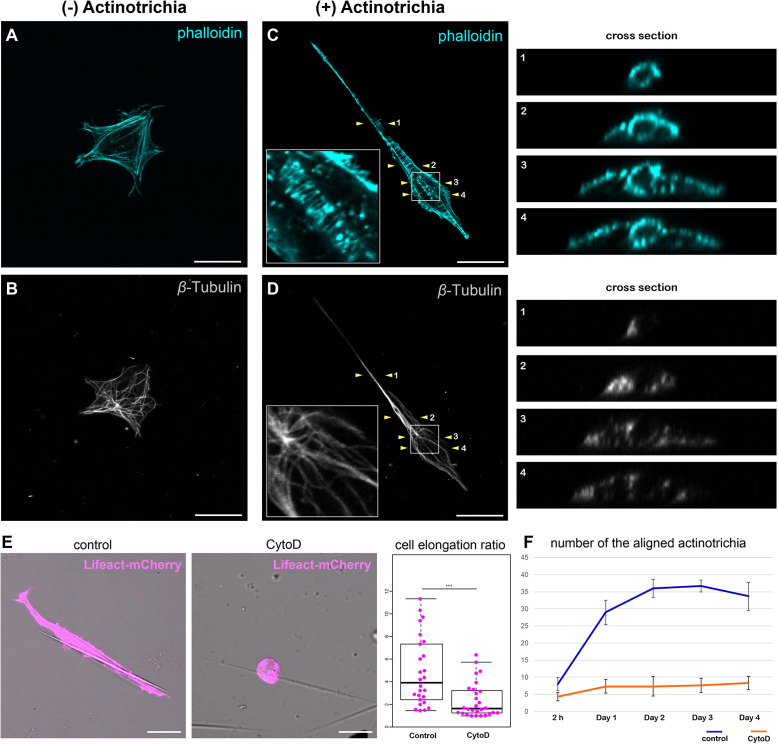
Inhibition of actin polymerization suppressed the orientation formation of actinotrichia. (A,B) A cultured mesenchymal cell without contact with actinotrichia was stained with phalloidin and anti-β-Tubulin antibodies. (A) Image of phalloidin staining and (B) anti-β-Tubulin antibody staining. Actin-rich fibers were detected below the plasma membrane and actin-rich filopodia structures were developed at the cell edge (A). β-Tubulin localization was observed radially from the center of the cell (B). (C,D) A cultured mesenchymal cell in contact with a single actinotrichia was stained with phalloidin and anti-β-Tubulin antibodies. The ortho-slice images between two yellow arrowheads are showed in the right panels and the magnified images of the white box are inset. (C) The image of phalloidin staining and (D) anti-β-Tubulin antibody staining. Strong accumulation of actin was detected around the actinotrichia. On the contrary, β-Tubulin localization was observed radially from the center of the cell and was not detected around the actinotrichia. (E) The morphology of the cultured mesenchymal cells at day 2 after culture under control and CytoD-treated conditions. The mesenchymal cells treated with CytoD tended to be unable to elongate along the actinotrichia axis. The elongation ratio of the CytoD treated cells is much lower than that of the control cells. (F) The number of aligned actinotrichia did not increased under the CytoD-treated condition. P-values: ***P < 0.001. Scale bars: 20 μm.

Acknowledgments
This image is the copyrighted work of the attributed author or publisher, and ZFIN has permission only to display this image to its users. Additional permissions should be obtained from the applicable author or publisher of the image. Full text @ Front Cell Dev Biol