
- Title
-
The Dynamics of Epidermal Stratification During Post-larval Development in Zebrafish
- Authors
- Rangel-Huerta, E., Guzman, A., Maldonado, E.
- Source
- Full text @ Dev. Dyn.
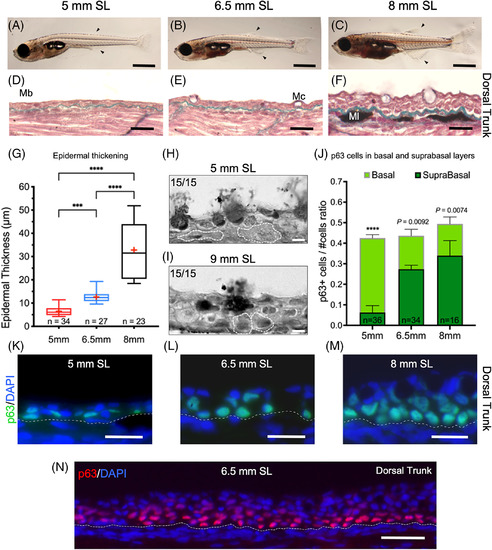
Epidermal thickening, changes in cell shape, and p63 expression. A‐C, Postlarval zebrafish developmental stages 5, 6.5, and 8 mm SL (arrowhead marks dorsal and anal fins). D‐F, Longitudinal sections showing skin tissue in the dorsal trunk stained with modified Masson's Trichrome, in 5, 6.5, and 8 mm SL. F, By 8 mm SL the epidermis has broadened notably, and the collagen can be seen above melanocytes located in the dermis. G, A box and whisker plot comparing epidermal thickness of 5, 6.5, and 8 mm SL postlarvae zebrafish (n = 34, n = 27, and n = 23). Measurements from histological sections, red crosses indicate mean values. H and I, cell contours (white dotted lines) of some of the 15 measured basal cells for each selected stage (5 and 9 mm SL). J, Stacked bars of p63/#cells ratio, normalized by DNA nuclear counterstaining. It compares the number of p63 labeled nuclei between basal and suprabasal cells. K‐M, p63/DAPI labeled nuclei from 5 to 8 mm SL epidermal cells. Initially, most of the label is retained by nuclei from basal cells, but later it switches to be distributed in suprabasal layers as well. N, Distribution of p63 labeling along with multiple layers of epidermis from 6.5 mm SL post‐larvae. Mb = basement membrane; Mc = mucous cell; Ml = melanocyte. G and J, ***P = .0003, ****P = <.0001. Images shown in A‐C low magnification images were obtained with a stereoscopic microscope. D, E, F, H, and I with an optical microscope 40X oil objective, K‐M with a 63X oil objective, and N with 20X objective. Scale bars: 1 mm in A‐C; 20 μm in D‐F, and K‐N. 5 μm in H and I |
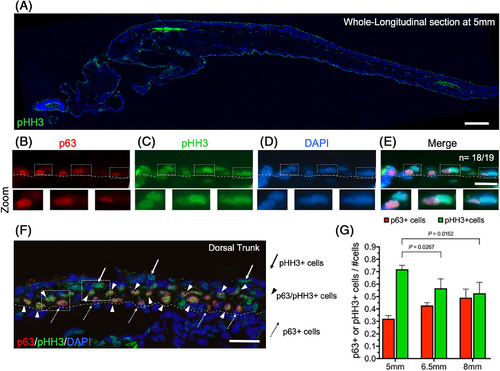
Active cell proliferation at the early stages of epidermal stratification. A, Longitudinal section of a zebrafish post‐larva at 5 mm SL. It was immunostained with anti‐phospho‐histone H3 antibody (pHH3) and labeled with DAPI. The main signal localizes to the epidermal layers of the skin. B‐E, Double immunostaining with anti‐pHH3 and anti‐p63 antibodies from 5‐mm‐SL larvae, where 18 out of 19 images showed the same pattern shown here. The bottom panels show higher magnification images from their respective top panels. Dotted squares mark labeled pHH3 and p63 cells that are contiguous to each other. F, Double Immunostaining with anti‐pHH3 and anti‐p63 antibodies at 6.5 mm SL. Dotted arrows mark p63+ cells, arrows point to pHH3 cells, and arrowheads indicate pHH3/p63 colocalization. G, Interleaved bars of p63 and pHH3 + cells/#cell ratio, normalized by DNA nuclear counterstaining with DAPI. Data were derived from independent larvae at 5 mm (n = 30), 6.5 mm (n = 15), and 8 mm (n = 8) SL. Images shown were obtained with a 10X objective in A, a 63X oil objective in B‐E and a 40X oil objective in F. Scale bar is 250 μm in A, and 20 μm in B‐F |
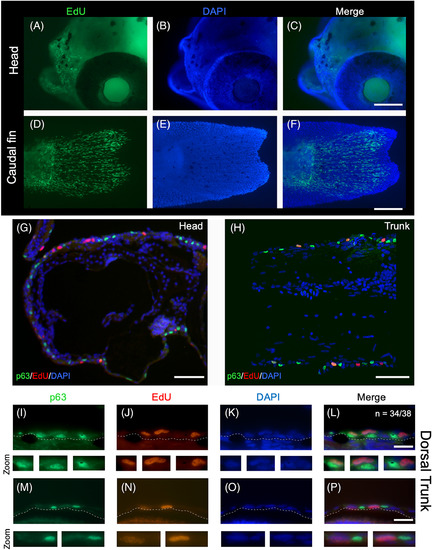
High levels of epidermal cell proliferation at 5 mm SL, as detected by EdU nucleotide incorporation. A‐F, Whole‐mount EdU staining from a 6‐day postfertilization (dpf) zebrafish larvae. A‐C, EdU‐labeled cells in the head. D‐F, EdU‐labeled cells in the caudal fin. G‐H, Longitudinal histological section of a 6‐dpf larva immunostained for anti‐p63 and subjected to EdU detection and DAPI staining. I‐P, Double labeling of anti‐p63 and EdU in longitudinal sections from 5‐mm‐SL fish. Selected nuclei from the top panels are shown amplified in the bottom panels. A representation of 34 out of 38 (34/38) images showing the same expression pattern. Scale bar in A‐H is 100 μm and in I‐P is 20 μm |
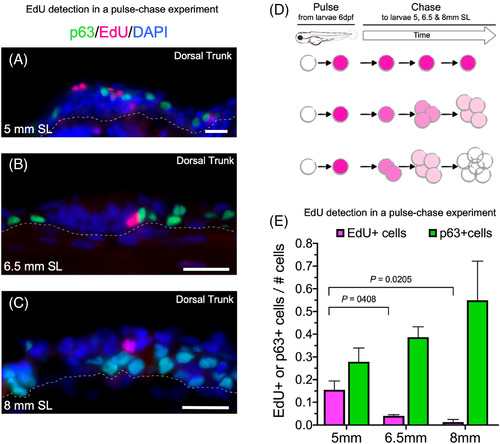
Label retaining cells in epidermis from post‐larval zebrafish detected using an EdU pulse‐chase experiment. A‐C, Epidermal Immunostaining with an anti‐p63 antibody and detection of EdU nucleotide incorporation at 5, 6.5 and 8 mm SL. D, Schematic representation of the pulse‐chase experiment. After 1.5 hours of EdU‐pulse in 6‐dpf larvae, and detection at 5, 6.5, and 8 mm SL. The EdU signal is progressively diluted in dividing cells but retained in label‐retaining cells (LRCs). E, Interleaved bars of p63 or EdU/# total cell ratio, normalized by DAPI‐DNA nuclear counterstaining from 5, 6.5, and 8 mm SL. Scale bar in A and B is 20 μm |
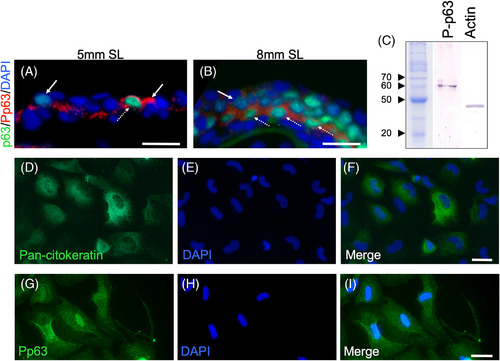
Presence of phosphorylated p63 during epidermal stratification. A, Double‐labeling of longitudinal sections of 5‐mm‐SL larvae with anti‐p63 and anti‐Pp63. B, Immunostaining with anti‐p63 and anti‐Pp63 at 8 mm SL. A‐B, Dotted arrows point to cells with Pp63 and high levels of p63, while arrows mark cells with Pp63 and low or null levels of p63. C, Western blot of Pp63, and Actin as a loading control. D‐I, Epidermal cells from zebrafish in primary cell culture labeled with anti‐p63 and anti‐Pp63. A and B Images were obtained with a 40X oil objective, while D‐I were obtained with a 63X oil objective. Scale bar in A, B, and D‐I is 20 μm |
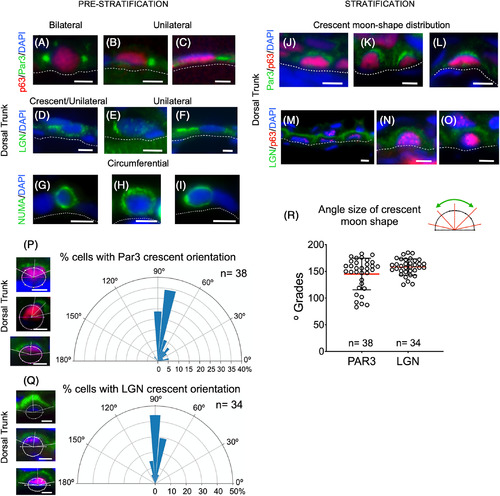
Asymmetric cell divisions take place during stratification in epidermal cells. A‐I, Pre‐stratification patterns of Par3, LGN, and NUMA proteins in epidermal cells at 5 mm SL. J‐O, Stratification patterns (6.5 mm SL) of the expression of Par3 and LGN in epidermis. A‐I, Multimodal patterns (bilateral, unilateral, and circumferential) of expression for Par3 (colocalized with p63), LGN, and NuMA in 5‐mm‐SL larvae. J‐O, Crescent moon‐shaped patterns of Par3, LGN expression colocalized with p63 in 6.5‐mm‐SL larvae. P, Panels on the left side show an example of how the orientation angle of the crescent moon‐shaped center and size measurements were performed (white lines) in images showing Par3 expression. The radial histogram in the plot shows the most common position of the Par3 crescent moon‐shaped center. Q, The left panels are examples of how the angle for the center of the LGN expression crescent moon‐shape was measured, along with the size (white lines). The right panel radial histograms show that a radial angle was the most common location of the LGN crescent moon‐shaped center. R, The scatter plot represents the angle size of the crescent moon shapes for Par3 and LGN. Images shown were obtained with a 63X oil objective. Scale bars: 5 μm |
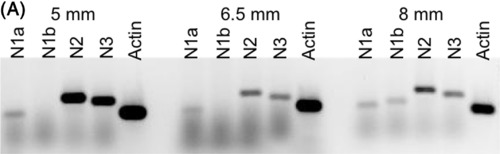
Expression of Notch genes in zebrafish at post‐larval stages 5‐8 mm SL. A, Expression of notch1a, notch1b, notch2, and notch3 genes by RT‐PCR at post‐larval stages 5, 6.5, and 8 mm SL. Total RNA was extracted from whole fish larvae |