
|
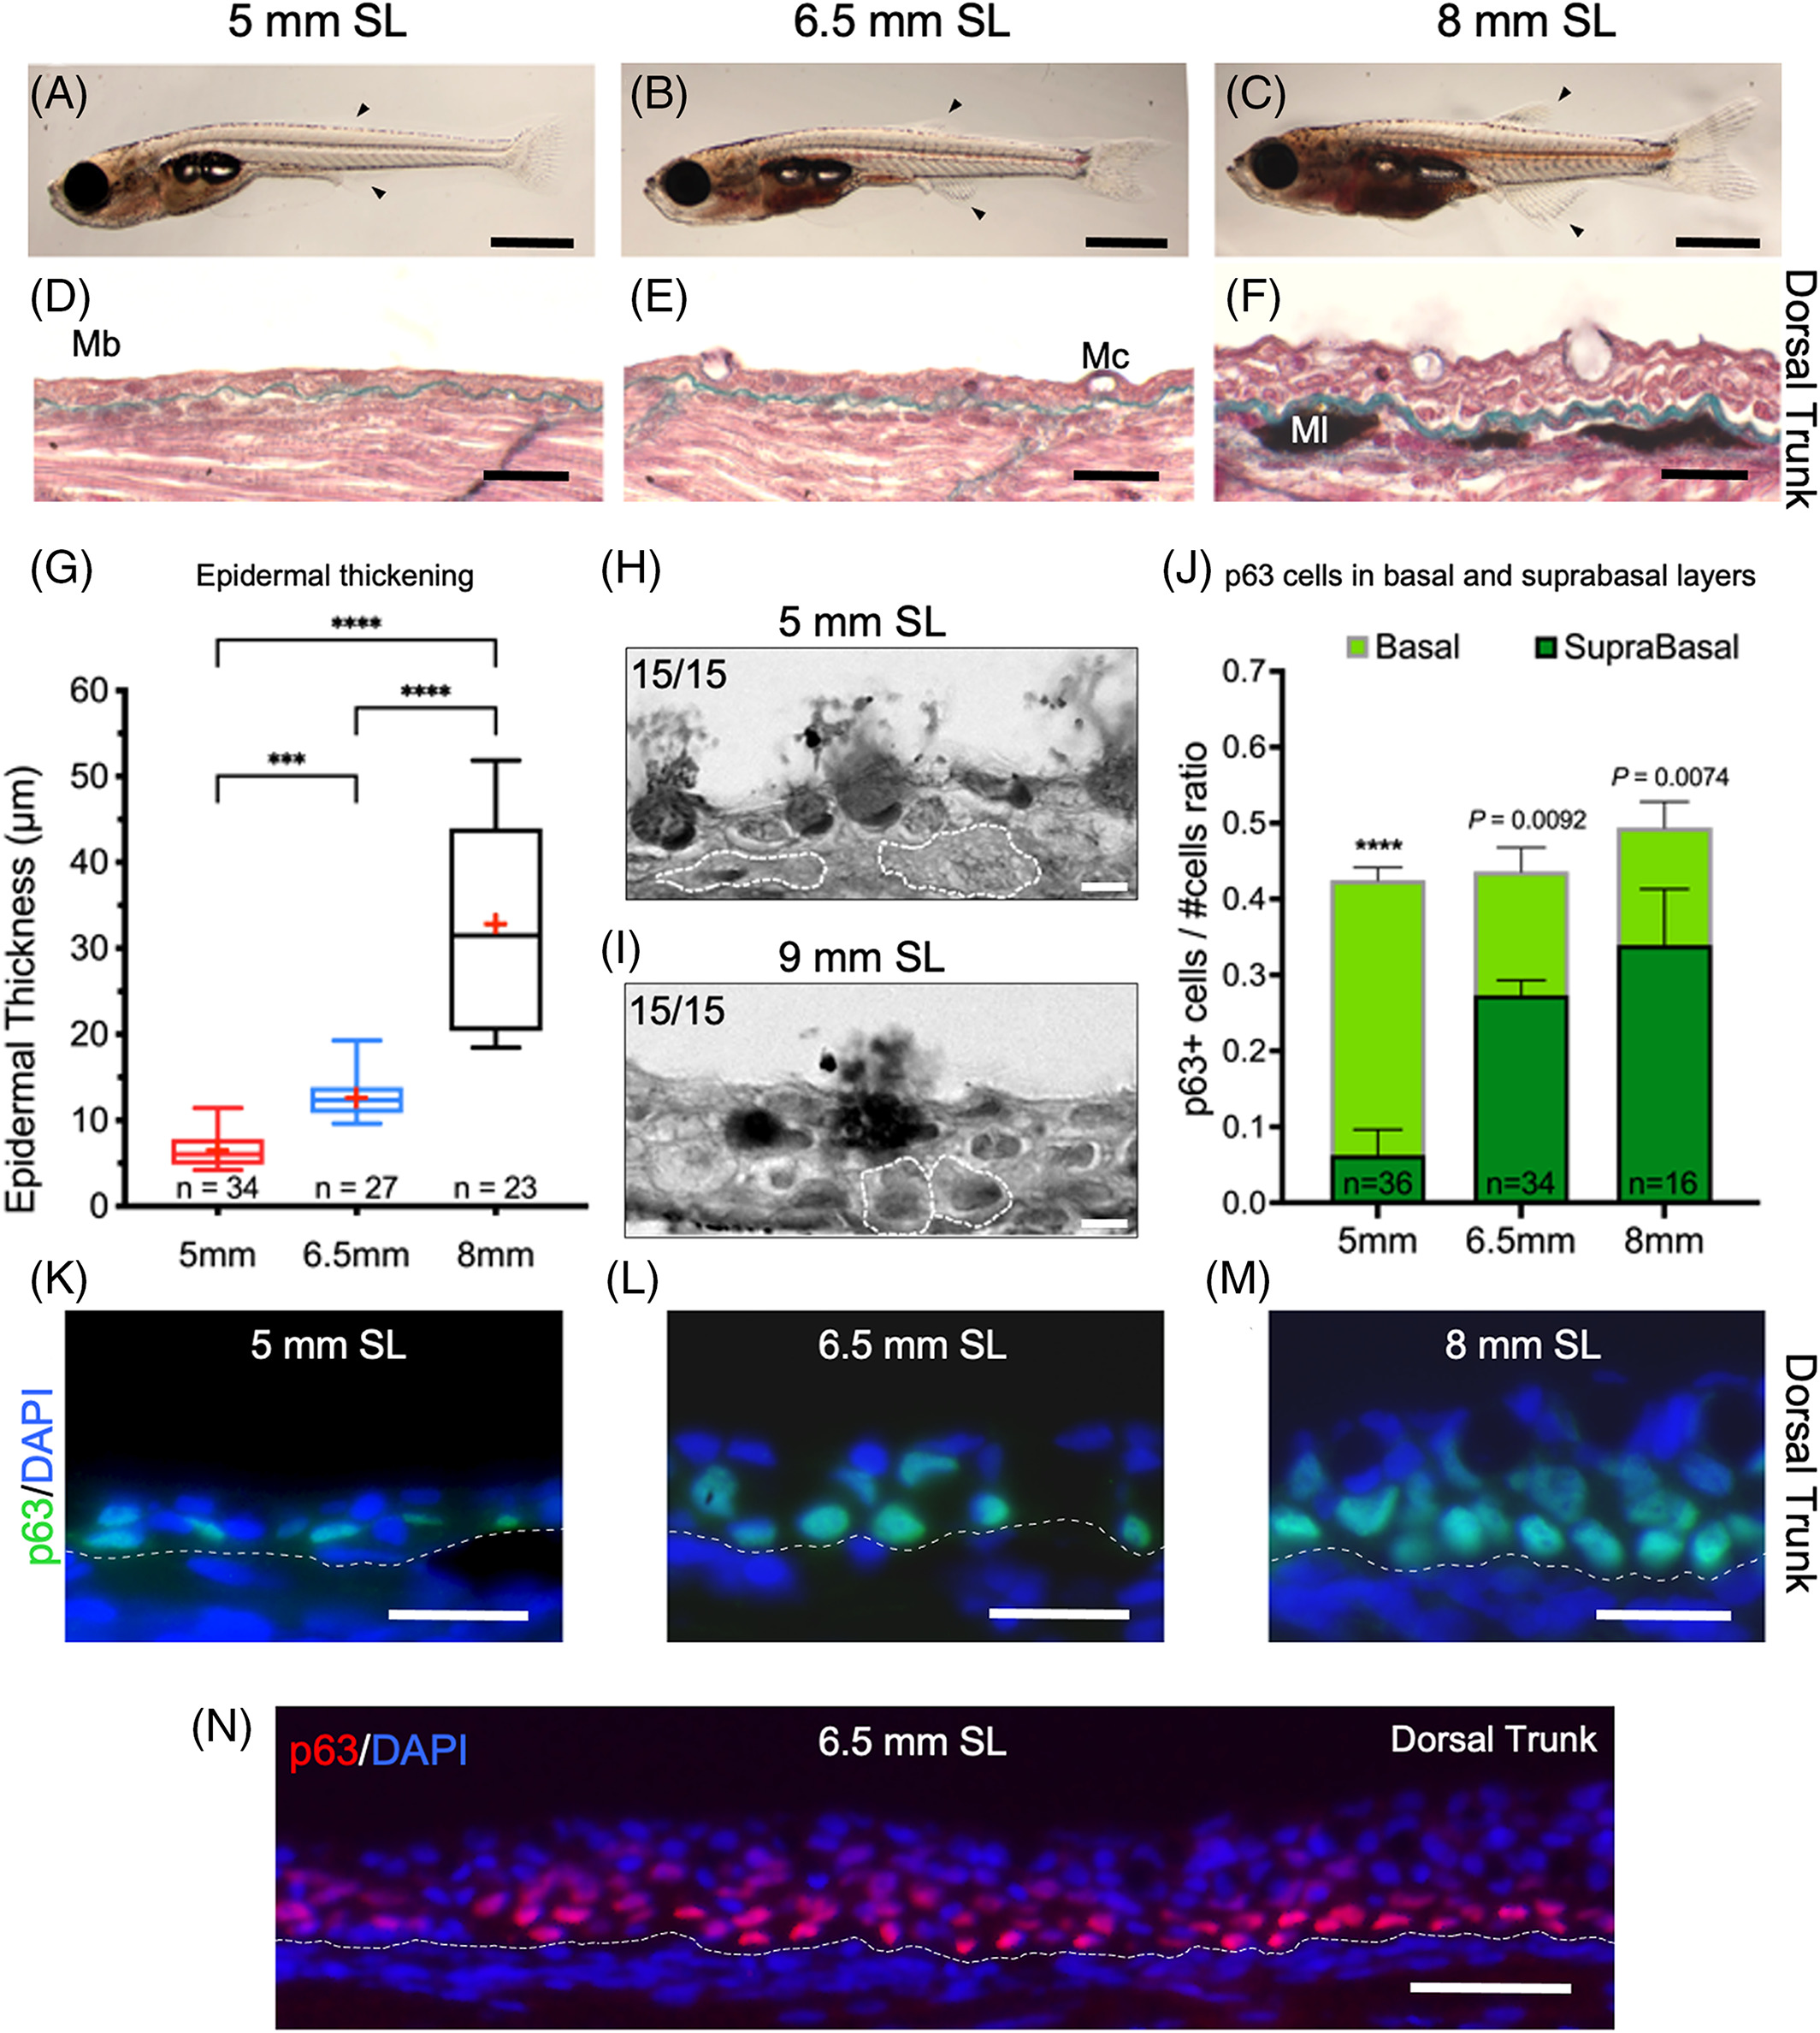
Fig. 1 Epidermal thickening, changes in cell shape, and p63 expression. A‐C, Postlarval zebrafish developmental stages 5, 6.5, and 8 mm SL (arrowhead marks dorsal and anal fins). D‐F, Longitudinal sections showing skin tissue in the dorsal trunk stained with modified Masson's Trichrome, in 5, 6.5, and 8 mm SL. F, By 8 mm SL the epidermis has broadened notably, and the collagen can be seen above melanocytes located in the dermis. G, A box and whisker plot comparing epidermal thickness of 5, 6.5, and 8 mm SL postlarvae zebrafish (n = 34, n = 27, and n = 23). Measurements from histological sections, red crosses indicate mean values. H and I, cell contours (white dotted lines) of some of the 15 measured basal cells for each selected stage (5 and 9 mm SL). J, Stacked bars of p63/#cells ratio, normalized by DNA nuclear counterstaining. It compares the number of p63 labeled nuclei between basal and suprabasal cells. K‐M, p63/DAPI labeled nuclei from 5 to 8 mm SL epidermal cells. Initially, most of the label is retained by nuclei from basal cells, but later it switches to be distributed in suprabasal layers as well. N, Distribution of p63 labeling along with multiple layers of epidermis from 6.5 mm SL post‐larvae. Mb = basement membrane; Mc = mucous cell; Ml = melanocyte. G and J, ***P = .0003, ****P = <.0001. Images shown in A‐C low magnification images were obtained with a stereoscopic microscope. D, E, F, H, and I with an optical microscope 40X oil objective, K‐M with a 63X oil objective, and N with 20X objective. Scale bars: 1 mm in A‐C; 20 μm in D‐F, and K‐N. 5 μm in H and I