
|
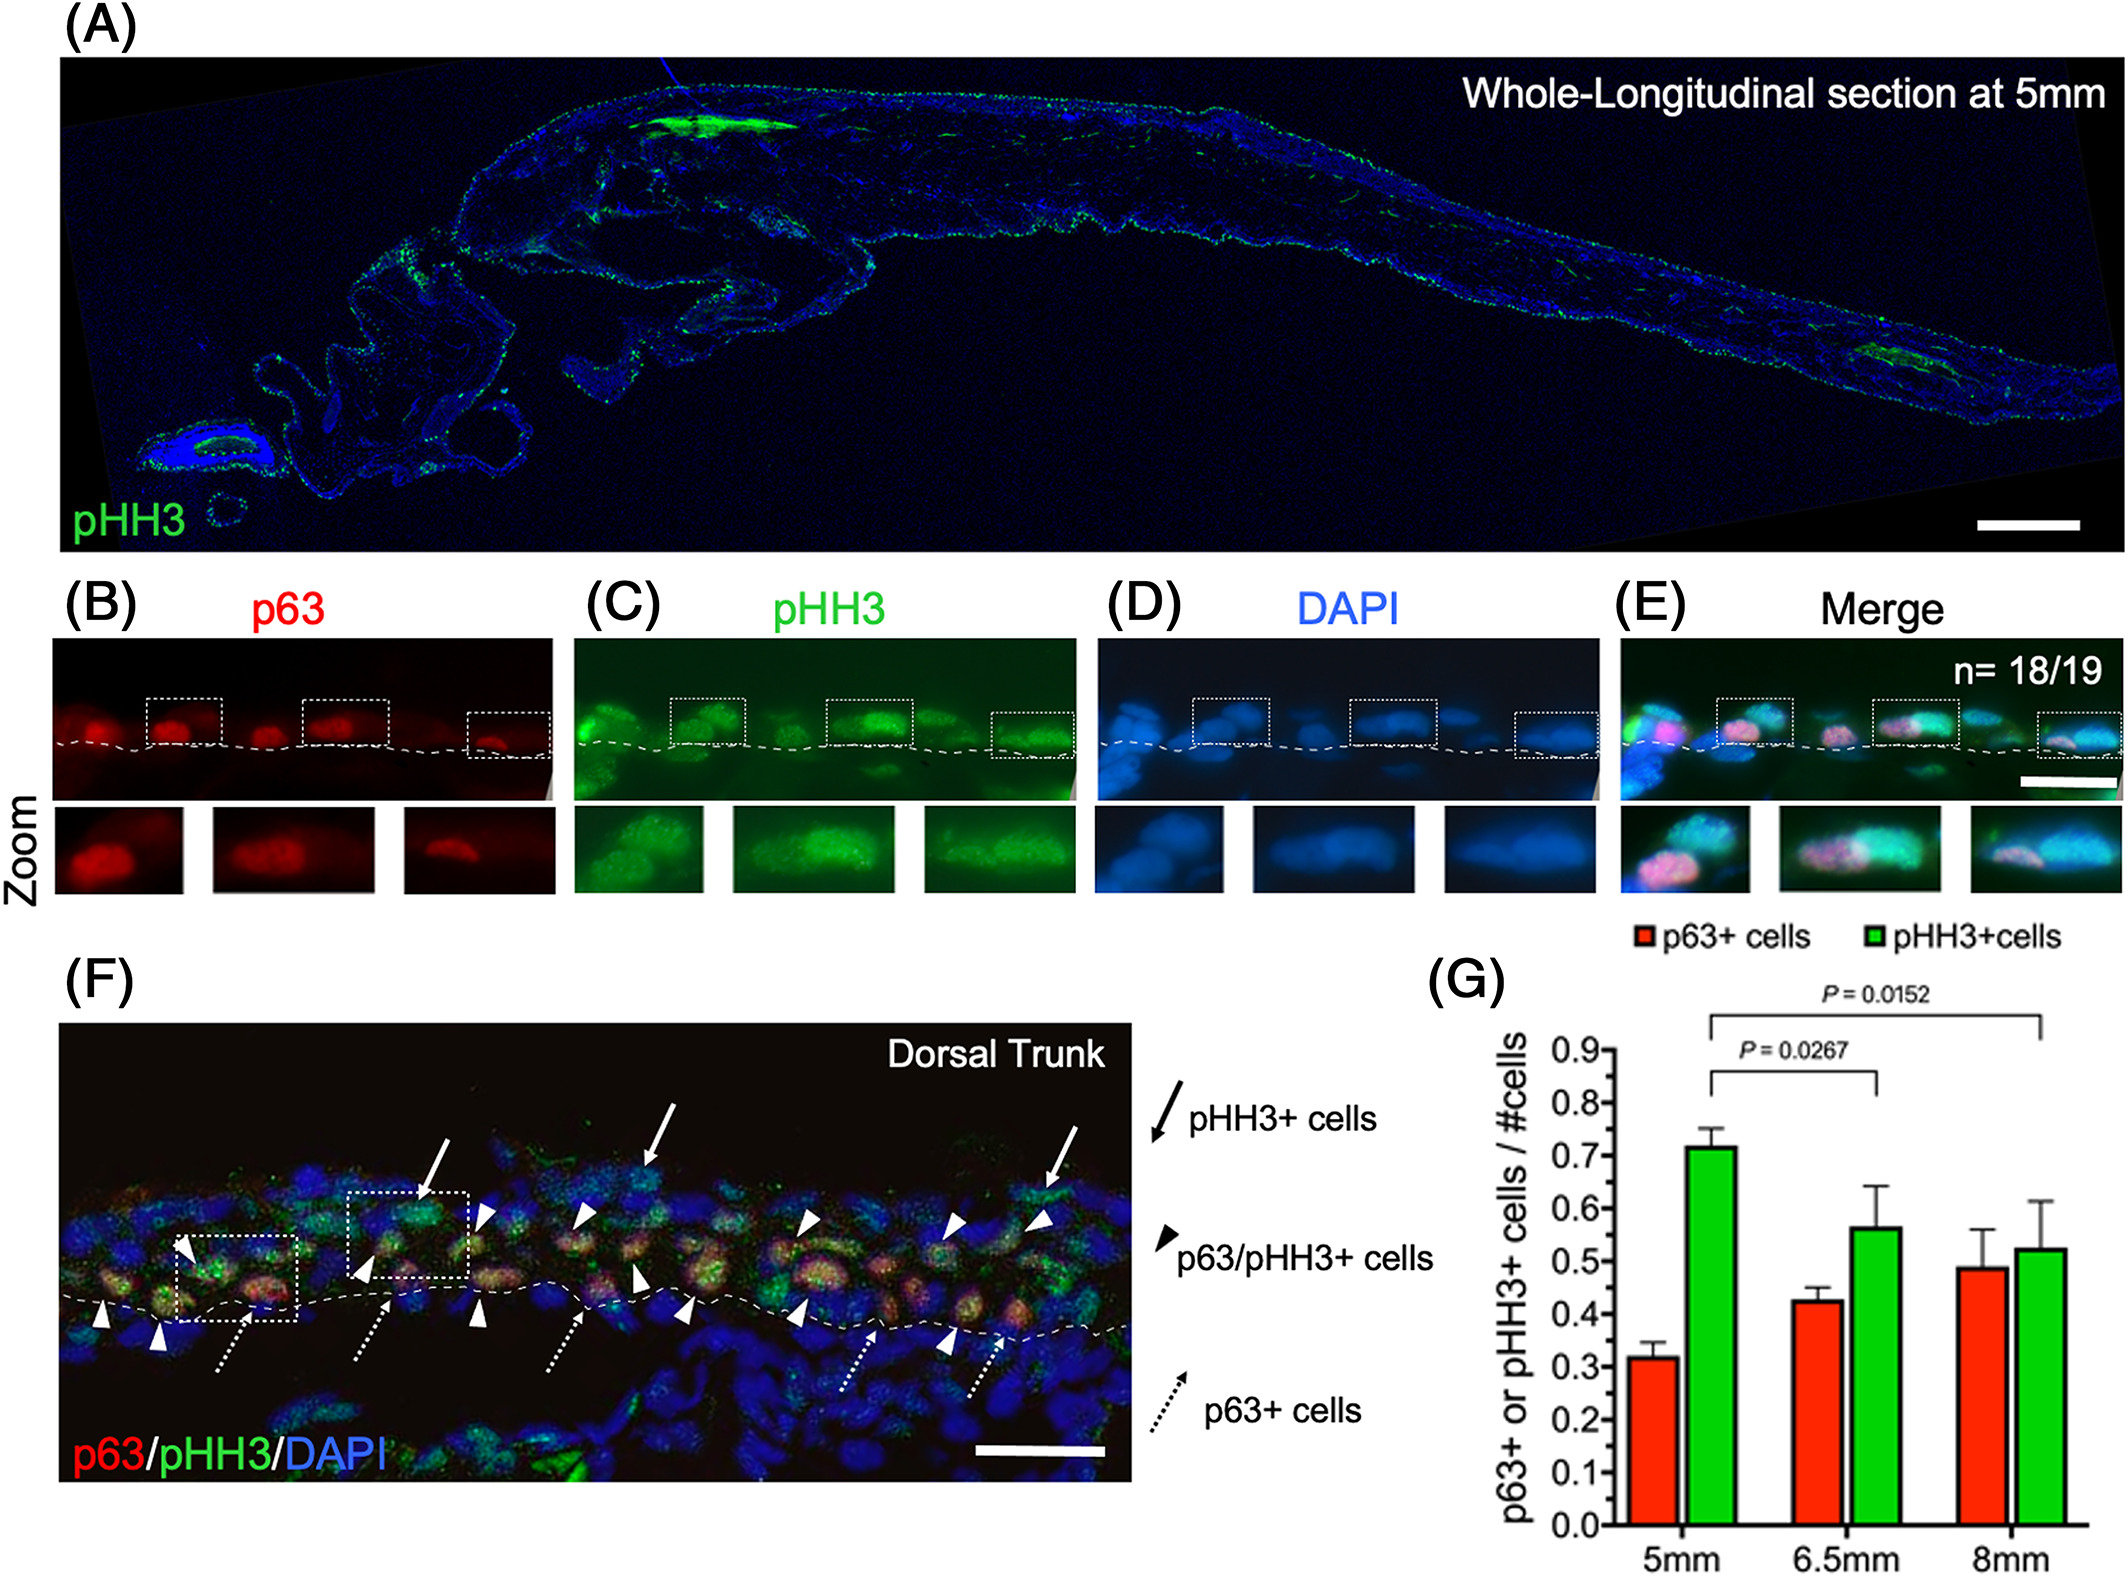
Fig. 2 Active cell proliferation at the early stages of epidermal stratification. A, Longitudinal section of a zebrafish post‐larva at 5 mm SL. It was immunostained with anti‐phospho‐histone H3 antibody (pHH3) and labeled with DAPI. The main signal localizes to the epidermal layers of the skin. B‐E, Double immunostaining with anti‐pHH3 and anti‐p63 antibodies from 5‐mm‐SL larvae, where 18 out of 19 images showed the same pattern shown here. The bottom panels show higher magnification images from their respective top panels. Dotted squares mark labeled pHH3 and p63 cells that are contiguous to each other. F, Double Immunostaining with anti‐pHH3 and anti‐p63 antibodies at 6.5 mm SL. Dotted arrows mark p63+ cells, arrows point to pHH3 cells, and arrowheads indicate pHH3/p63 colocalization. G, Interleaved bars of p63 and pHH3 + cells/#cell ratio, normalized by DNA nuclear counterstaining with DAPI. Data were derived from independent larvae at 5 mm (n = 30), 6.5 mm (n = 15), and 8 mm (n = 8) SL. Images shown were obtained with a 10X objective in A, a 63X oil objective in B‐E and a 40X oil objective in F. Scale bar is 250 μm in A, and 20 μm in B‐F