
|
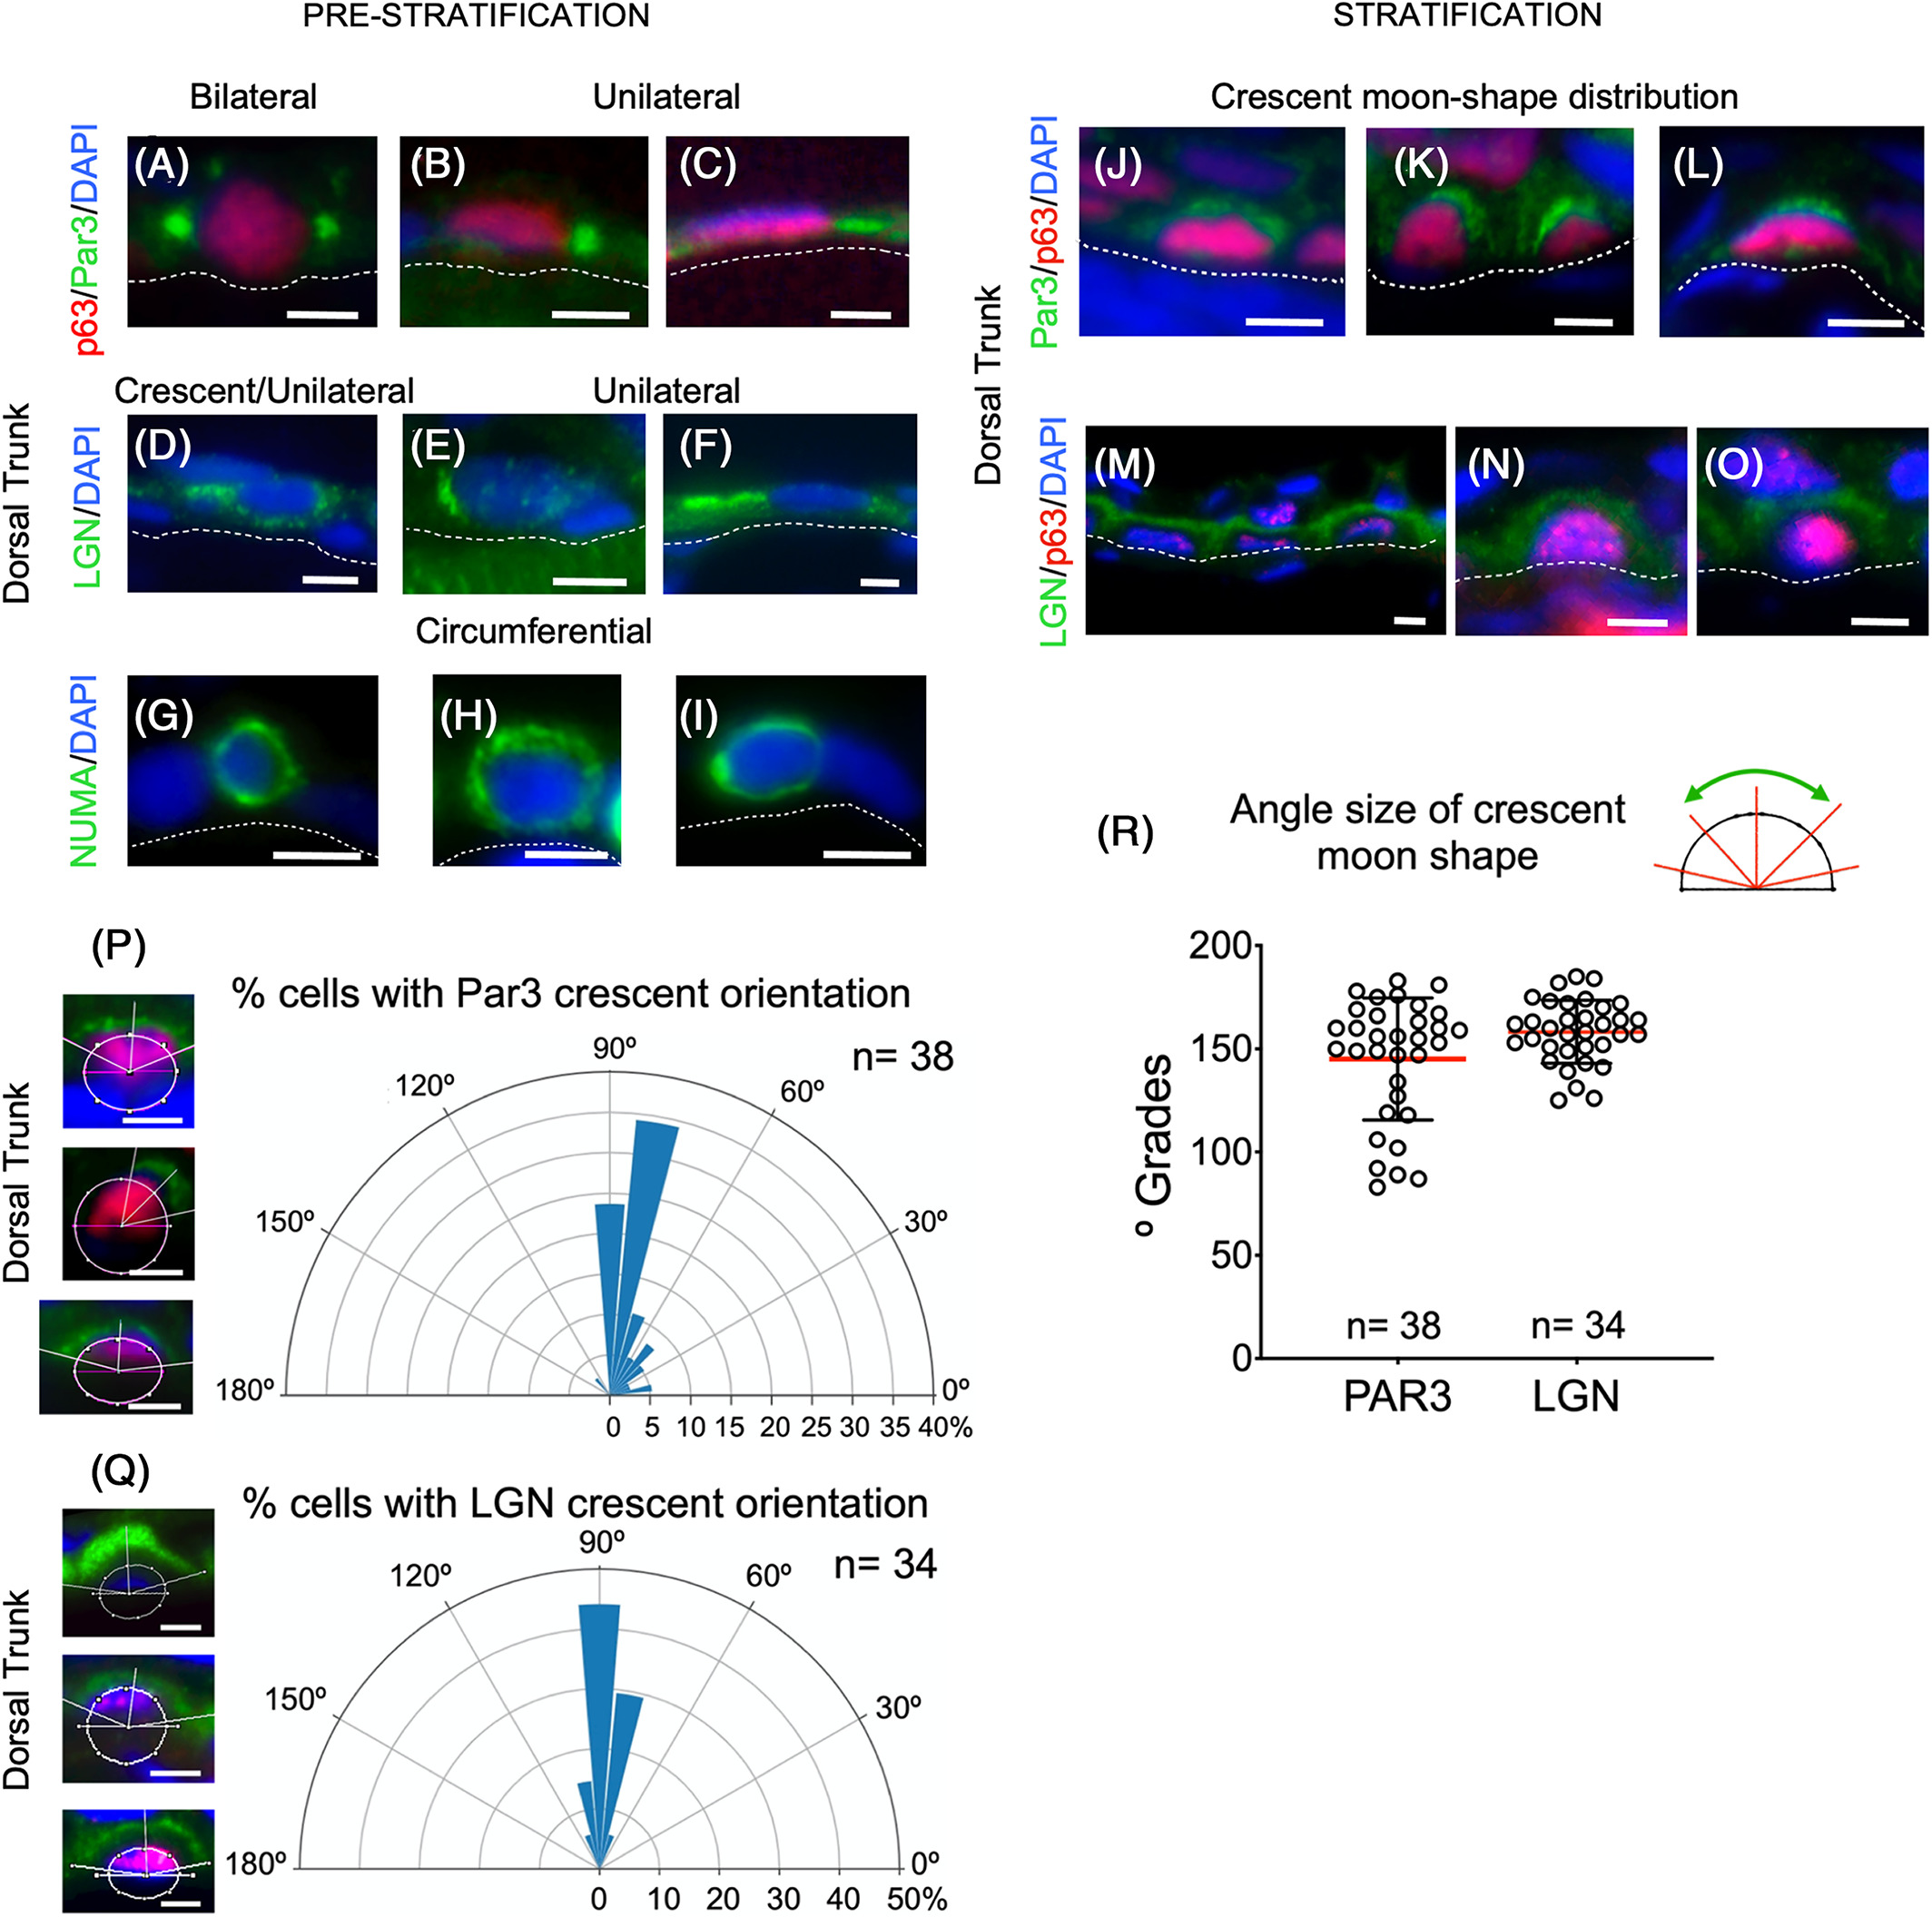
Fig. 6 Asymmetric cell divisions take place during stratification in epidermal cells. A‐I, Pre‐stratification patterns of Par3, LGN, and NUMA proteins in epidermal cells at 5 mm SL. J‐O, Stratification patterns (6.5 mm SL) of the expression of Par3 and LGN in epidermis. A‐I, Multimodal patterns (bilateral, unilateral, and circumferential) of expression for Par3 (colocalized with p63), LGN, and NuMA in 5‐mm‐SL larvae. J‐O, Crescent moon‐shaped patterns of Par3, LGN expression colocalized with p63 in 6.5‐mm‐SL larvae. P, Panels on the left side show an example of how the orientation angle of the crescent moon‐shaped center and size measurements were performed (white lines) in images showing Par3 expression. The radial histogram in the plot shows the most common position of the Par3 crescent moon‐shaped center. Q, The left panels are examples of how the angle for the center of the LGN expression crescent moon‐shape was measured, along with the size (white lines). The right panel radial histograms show that a radial angle was the most common location of the LGN crescent moon‐shaped center. R, The scatter plot represents the angle size of the crescent moon shapes for Par3 and LGN. Images shown were obtained with a 63X oil objective. Scale bars: 5 μm