FIGURE SUMMARY
Title

Targeted RNA Knockdown by a Type III CRISPR-Cas Complex in Zebrafish

Authors
Fricke, T., Smalakyte, D., Lapinski, M., Pateria, A., Weige, C., Pastor, M., Kolano, A., Winata, C., Siksnys, V., Tamulaitis, G., Bochtler, M.
Source
Full text @ CRISPR J

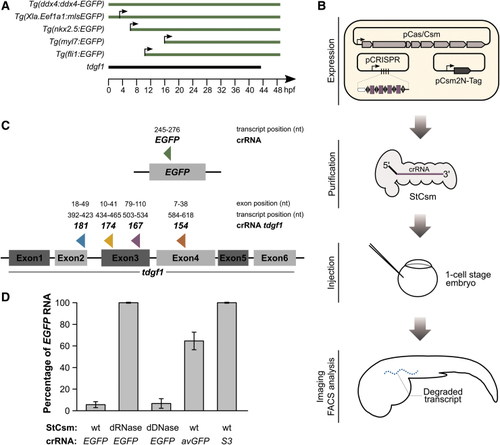
Experimental design and in vitro tool validation. (A) Onset of transcription of transcripts targeted in this study. The Tg(ddx4:ddx4-EGFP fish express the transgene strictly maternally, there is no zygotic expression for at least 50 hours postfertilization (hpf).40 In germ cells, the mRNA is exempt from the otherwise widespread RNA degradation at the mid-blastula transition.55 The Tg(Xla.Eef1a1:mlsEGFP) fish express EGFP with an N-terminal mitochondrial localization signal derived from subunit VIII of cytochrome oxidase under the control of the constitutive elongation factor 1α (EF-1α).41 Expression is both maternal and zygotic. The Tg(nkx2.5:EGFP), Tg(myl7:GFP) and Tg(fli1:EGFP) express the transgene zygotically. The Tg(nkx2.5:EGFP) fish first exhibit fluorescence in the ventral margin of the embryo at the onset of gastrulation (∼5.5 hpf). By 2 days postfertilization (dpf), EGFP expression is limited to the heart.42Tg(myl7:GFP) expression becomes detectable at ∼16 hpf in myocardial cells of the heart and persists for the lifetime of the animal.43 The Tg(fli1:EGFP) fish start to express EGFP from the three-somite stage (∼10 hpf). At 1 dpf, trunk and segmental vessels and cells of erythroid morphology are fluorescently labelled, and at 2 dpf, there is also fluorescence in the neural crest derived aortic arches and the developing jaw.44 Endogenous tdgf1 is both maternally and zygotically expressed.45(B) Experimental workflow. Cas/Csm proteins were co-expressed with a synthetic CRISPR array harboring four identical spacers (to produce only one type of StCsm complex), or four different spacers (to produce mixtures of StCsm complexes). Targeting and control StCsm complexes were purified as intact ribonucleoproteins from Escherichia coli extracts. Injections were done into the yolk of 1-cell stage embryos, and EGFP fluorescence, or phenotype was then monitored at later time points (1 dpf, 2 dpf, 5 dpf). (C) Location of the single site in the EGFP transcripts and of the four sites chosen for targeting in tdgf1 by our method. The names for tdgf1 target sites and spacers (“181”, “174”, “176”, “154”) reflect our internal site scores. (D) Quantification of radioactively labeled target EGFP RNA after 1 h of in vitro incubation with different StCsm complexes. A low amount of leftover EGFP RNA indicates a high targeting efficiency.

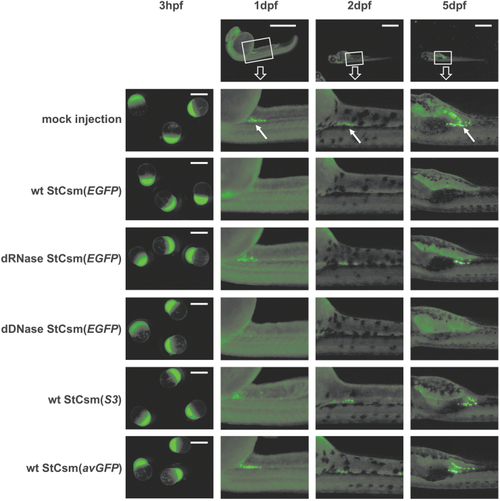
Microscopy of StCsm mediated
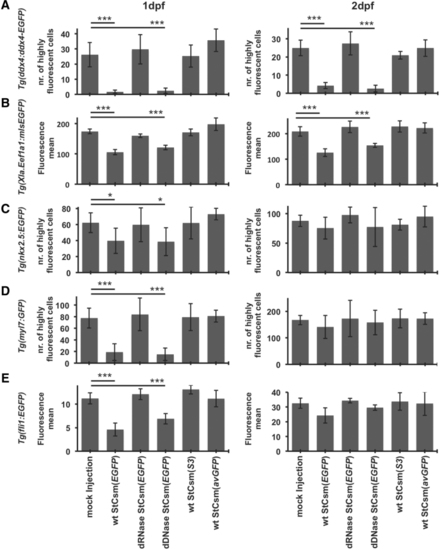
 EGFP knockdown in Tg(ddx4:ddx4-EGFP) fish. Fluorescence from Tg(ddx4:ddx4-EGFP) fish after injection with wildtype (wt) or mutant StCsm complexes are shown. The arrows indicate the location of primordial germ cells. Injection was done at the 1-cell embryo stage, observations were at 3 hpf, 1 dpf, 2 dpf, and 5 dpf. The scale bar represents 1 mm. Boxes in the top row show the region of the embryo magnified in panels below. Arrows point to germ cells.

Quantification of EGFP knockdown efficiency by fluorescence-activated cell sorting analysis. Enhanced green fluorescent protein fluorescence in (A)Tg(ddx4:ddx4-EGFP), (B)Tg(Xla.Eef1a1:mlsEGFP), (C)Tg(nkx2.5:EGFP), (D)Tg(myl7:GFP) and (E)Tg(fli1:EGFP) fish was quantified 1 dpf and 2 dpf by flow cytometry of minced and trypsinized embryos. For Tg(ddx4:ddx4-EGFP), Tg(nkx2.5:EGFP) and Tg(myl7:GFP) embryos, the number of highly fluorescent cells (at least 50-fold background fluorescence) was counted. Results are from 3 independent experiments; error bars represent one standard deviation. *P < 0.05 as compared with respective controls, ***P < 0.001 as compared with respective controls. Data are represented as mean ± SEM.

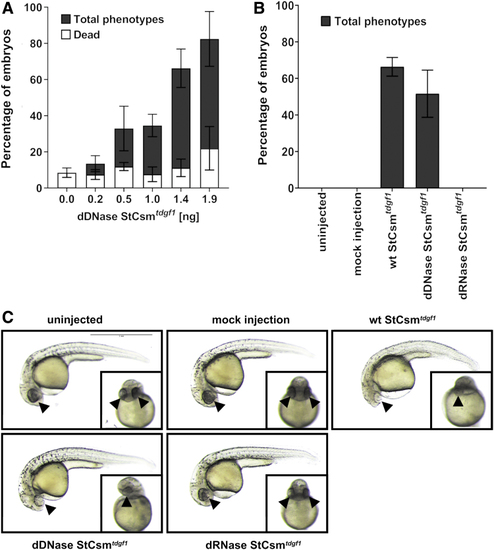
Knockdown of endogenous tdgf1. (A) Dose-dependent penetrance and lethality were assessed after injection of dDNase StCsm(tdgf1167,174,154,181). Different amounts of dDNase StCsm(tdgf1167,174,154,181) were injected in a constant volume of 1 nL at the 1-cell stage. Phenotypes were screened after 24 hpf on the basis of morphological changes. Data represented as mean ± SEM. (B) Bar plot comparing the efficiency of different StCsm complexes. 1.5 ng of either wt, dRNase or dDNase StCsm(tdgf1167,174,154,181) complexes in 1 nL volume was injected in the same clutch of embryos. Results from injections in five different clutches of embryos are presented. Data represented as mean ± SEM. (C) Lateral and ventral images of the injected embryos after 24 hpf. Arrows indicate position of eye or eyes. Scale bar represents 1 mm.

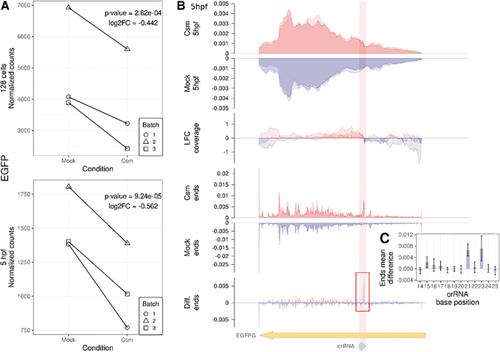
Analysis of on-target effects of EGFP knockdown. (A) Changes in EGFP read counts at the 128-cell stage (top panel) and 5 hours post fertilization (bottom panel). Black lines connect data points from the same replica batch. Each plot is annotated with log2 fold change value and P-value from the likelihood-ratio test. (B) Read coverage analysis of the EGFP transcript at 5 hpf. The top two panels (StCsm 5 hpf and mock 5 hpf) depict the read coverage represented as a fraction of total coverage at each position for the StCsm injected (red) and mock injected (blue) samples. Each replicate is plotted independently with the color shades gaining intensity where the plots overlap. The third panel (log-fold change [LFC] coverage) shows the log2 of the ratio between the read coverage of the StCsm injected and mock injected samples (positive values red, negative values blue). The fourth and fifth panel (StCsm ends and Mock ends) depicts the distribution of sequencing fragment ends over the whole EGFP transcript sequence for the StCsm injected (red) and mock injected (blue) samples. The sixth panel (Diff. ends), shows the difference in the sequencing fragment end distribution between the two samples, obtained by subtracting the mean amount of fragment ends of the mock sample from the mean amount of fragment ends at each coordinate of the StCsm sample. The positive values are colored red and negative are blue. The red rectangle illustrates the space enlarged on panel (C) in relation to the CRISPR RNA (crRNA) sequence. (C) The difference in the sequencing fragments end means at each coordinate in relation to the crRNA sequence. Error bars show 95% confidence interval.

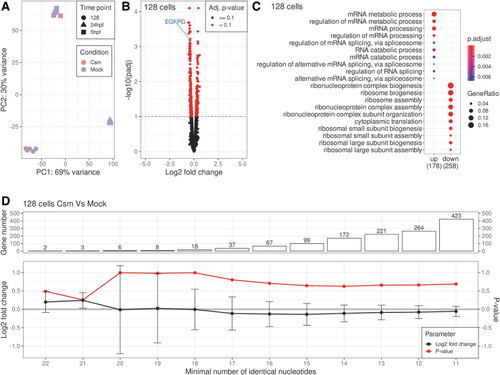
Analysis of off-target effects of EGFP knockdown. (A) Principle component analysis of mRNA expression levels in all sequenced samples. The first two principle components are shown and are annotated by the percentage of the variance explained by each of those components. The colors differentiate the samples by experimental condition, while the shape by analysis time point. (B) Volcano plot showing the relation of the log2 transformed fold changes of read counts at 128-cell stage to their log10 transformed P-values adjusted for multiple comparison tests with the Benjamini and Hochberg correction, as implemented in DESeq2. The point originating from the EGFP transcript has been marked. The dashed red line shows the 0.1 adjusted p-value threshold. (C) Comparison of biological process gene ontology terms enrichment of the upregulated and downregulated genes. Dots represent the term enrichment with color coding: red indicates high enrichment and blue indicates low. The sizes of the dots represent the ratio of genes containing the relevant term within up or down-regulated groups to the total number of genes in that group. (D) The plots showing the log2 transformed fold change and its respective P-value from likelihood ratio test for the full model, containing both condition and batch factors, and the reduced model containing only the batch, fitted to the counts of the groups of genes sharing the same minimal number of complementary nucleotides to the crRNA. The error bars show the standard error of the estimate. With each required nucleotide less, new genes are added to the tested group. The bar plot in the uppermost panel depicts the size of the relevant group.

Acknowledgments
This image is the copyrighted work of the attributed author or publisher, and ZFIN has permission only to display this image to its users. Additional permissions should be obtained from the applicable author or publisher of the image. Full text @ CRISPR J