
FIG. 4.
- ID
- ZDB-IMAGE-200905-11
- Publication
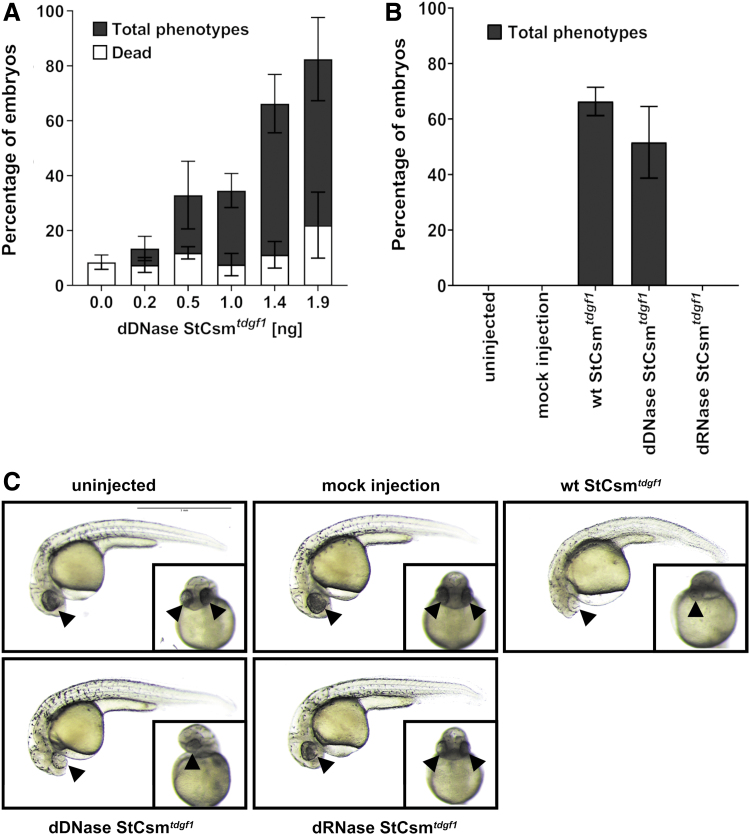
- Fricke et al., 2020 - Targeted RNA Knockdown by a Type III CRISPR-Cas Complex in Zebrafish
- All Figures
- Figures for Fricke et al., 2020
|
FIG. 4.
Knockdown of endogenous