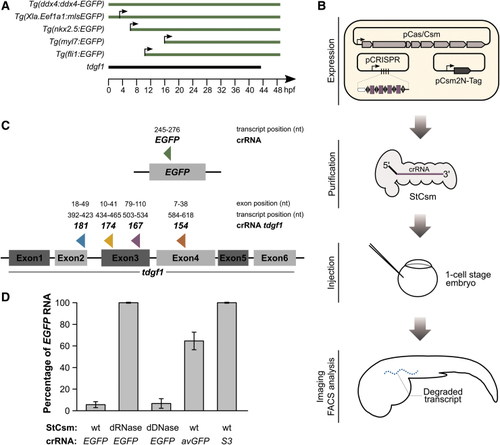
Experimental design and in vitro tool validation. (A) Onset of transcription of transcripts targeted in this study. The Tg(ddx4:ddx4-EGFP fish express the transgene strictly maternally, there is no zygotic expression for at least 50 hours postfertilization (hpf).40 In germ cells, the mRNA is exempt from the otherwise widespread RNA degradation at the mid-blastula transition.55 The Tg(Xla.Eef1a1:mlsEGFP) fish express EGFP with an N-terminal mitochondrial localization signal derived from subunit VIII of cytochrome oxidase under the control of the constitutive elongation factor 1α (EF-1α).41 Expression is both maternal and zygotic. The Tg(nkx2.5:EGFP), Tg(myl7:GFP) and Tg(fli1:EGFP) express the transgene zygotically. The Tg(nkx2.5:EGFP) fish first exhibit fluorescence in the ventral margin of the embryo at the onset of gastrulation (∼5.5 hpf). By 2 days postfertilization (dpf), EGFP expression is limited to the heart.42Tg(myl7:GFP) expression becomes detectable at ∼16 hpf in myocardial cells of the heart and persists for the lifetime of the animal.43 The Tg(fli1:EGFP) fish start to express EGFP from the three-somite stage (∼10 hpf). At 1 dpf, trunk and segmental vessels and cells of erythroid morphology are fluorescently labelled, and at 2 dpf, there is also fluorescence in the neural crest derived aortic arches and the developing jaw.44 Endogenous tdgf1 is both maternally and zygotically expressed.45(B) Experimental workflow. Cas/Csm proteins were co-expressed with a synthetic CRISPR array harboring four identical spacers (to produce only one type of StCsm complex), or four different spacers (to produce mixtures of StCsm complexes). Targeting and control StCsm complexes were purified as intact ribonucleoproteins from Escherichia coli extracts. Injections were done into the yolk of 1-cell stage embryos, and EGFP fluorescence, or phenotype was then monitored at later time points (1 dpf, 2 dpf, 5 dpf). (C) Location of the single site in the EGFP transcripts and of the four sites chosen for targeting in tdgf1 by our method. The names for tdgf1 target sites and spacers (“181”, “174”, “176”, “154”) reflect our internal site scores. (D) Quantification of radioactively labeled target EGFP RNA after 1 h of in vitro incubation with different StCsm complexes. A low amount of leftover EGFP RNA indicates a high targeting efficiency.
|
