FIGURE SUMMARY
Title

Microfibril-associated glycoprotein 4 (Mfap4) regulates haematopoiesis in zebrafish

Authors
Ong, S.L.M., de Vos, I.J.H.M., Meroshini, M., Poobalan, Y., Dunn, N.R.
Source
Full text @ Sci. Rep.

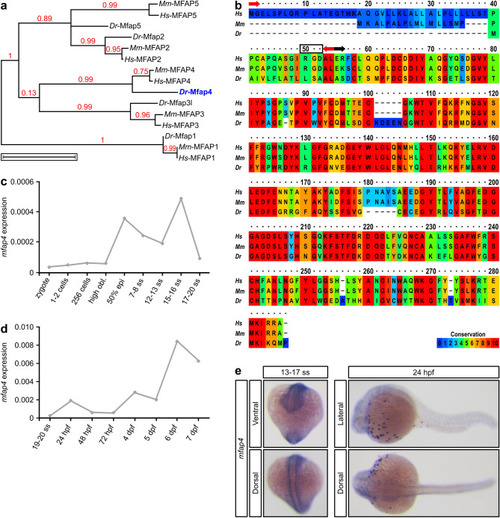
Alignment of vertebrate Mfap4 proteins and mfap4 expression during zebrafish development. (a) Phylogenetic analysis of human (Homo sapiens, Hs) MFAP family members and their murine (Mus musculus, Mm) and piscine (Danio rerio, Dr) orthologs. Scale bar represents 1 amino acid substitution per site. (b) Amino acid sequence alignment of human, murine and zebrafish MFAP4 proteins displayed in ClustalX color scheme. Red arrows demarcate the start and end of the 16 amino acid signal peptide (www.uniprot.org); black box highlights the RGD sequence; black arrow indicates the start of the fibrinogen-related domain (FReD). (ce) Zebrafish mfap4 expression analysis by (c,d) quantitative RT-PCR (mean expression in twenty pooled embryos/larvae per time point) relative to the expression of the housekeeping gene actin, beta 1 (actb1) and by (e) whole-mount RNA in situ hybridization (purple staining)—ventral (13–17 somite stage, ss), dorsal (15–17 ss and 24 h post fertilization, hpf) and lateral (24 hpf) views. Phylogenetic analysis in panel (a) was performed with Phylogeny.fr online software (available at www.phylogeny.fr)63,64. Alignment in panel (b) was performed with the online PRALINE Multiple Sequence Alignment software (Vrije Universiteit Amsterdam, Centre for Integrative Bioinformatics VU, available at www.ibi.vu.nl/programs/pralinewww/). Graphs in panels (c) and (d) were generated with Microsoft Excel (for Mac 2011, version 14.7.7). This figure was created with Inkscape software version 0.92 (available at https://www.inkscape.org/).

EXPRESSION / LABELING:
Gene:
Fish:
Anatomical Terms:
Stage Range: 50%-epiboly to Days 7-13

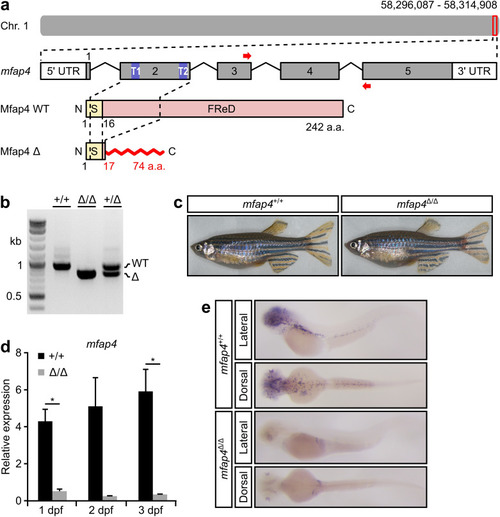
Generation of a loss-of-function mutation in zebrafish mfap4. (a) Guide RNA target sites (T1 and T2, in blue) in exon 2 for CRISPR/Cas9 gene editing of the zebrafish mfap4 genomic locus. The resulting 150 base pair (bp) deletion is predicted to generate a truncated 74 amino acid (a.a.) protein product, p.S17Rfs58X. Abbreviations: FReD, fibrinogen-related domain; C, C-terminal; Chr, Chromosome; N, N-terminal; S, signal peptide. (b) Genotyping analysis of wild-type (WT, +/+) and mfap4 heterozygous (+ /∆) and homozygous (∆/∆) mutants. The WT amplicon length is 946 bp and the mutant amplicon length is 795 bp (see Materials and Methods for additional details). The full gel image can be found in Fig. S5. (c) Representative images of 4-month-old WT and mfap4∆/∆ fish. (d) Quantitative RT-PCR analysis with primers indicated in panel (a) by red arrows relative to actb1 reveals that the mutant mfap4 transcript is barely detectable (significant at 1 dpf (P = 0.029612) and 3 dpf (P = 0.041617), but not at 2 dpf (P = 0.084486); assessed by Student’s t-test), which suggests the mfap4p.S17Rfs58X mutant transcript is degraded. Error bars represent the standard error of the mean (s.e.m.) of technical triplicates of 20 pooled embryos per genotype per time point. (e) Whole-mount in situ hybridization of mfap4 in WT and mfap4∆/∆ larvae at 3 days post fertilization. The graph in panel (d) was generated with Microsoft Excel (for Mac 2011, version 14.7.7). This figure was created with Inkscape software version 0.92 (available at https://www.inkscape.org/).

EXPRESSION / LABELING:
Gene:
Fish:
Anatomical Terms:
Stage Range: Prim-5 to Protruding-mouth
PHENOTYPE:
Fish:
Observed In:
Stage Range: Prim-5 to Adult

mfap4 mutant fish have reduced numbers of macrophages. (a) The adult tail fins of wild-type (WT, mfap4+/+) and mfap4∆/∆ mutant fish were amputated (red dotted line). Cells in the remaining part of the tail fin (blue dotted box) were dissociated and macrophage numbers quantitated by FACS using the Tg(mpeg1:EGFP) fluorescent reporter. (b) FACS analysis depicting side scatter (SSC) on the y-axis and Tg(mpeg1:EGFP) fluorescence on the x-axis. (c) Graphical representation of mean macrophage numbers of fifteen biological replicates per genotype [determined as in panel (b)] for various time points post amputation. At most analyzed time points, there are significantly fewer macrophages in mfap4∆/∆ tail fins as compared to the WT fins (0 days post amputation (dpa), P = 0.0043; 1 dpa, P = 0.0264; 4 dpa, P = 0.0049; 7 dpa, P = 0.0892; 11 dpa, P = 0.0235; 14 dpa, P = 0.0145; assessed by Mann–Whitney-U test). (d) Quantification of macrophage numbers in tail fins at the time points shown in (c) relative to uncut fins. There is no delay in the recruitment of macrophages. Error bars in (c) and (d) represent the standard error of the mean (s.e.m.) of biological replicates. (e) Representative images of regenerated WT and mfap4∆/∆ tail fins two months post amputation. Images in panel (b) were generated with FlowJo V10 software (FlowJo LLC). Graphs in panels (c) and (d) were generated with Microsoft Excel (for Mac 2011, version 14.7.7). This figure was created with Inkscape software version 0.92 (available at https://www.inkscape.org/).

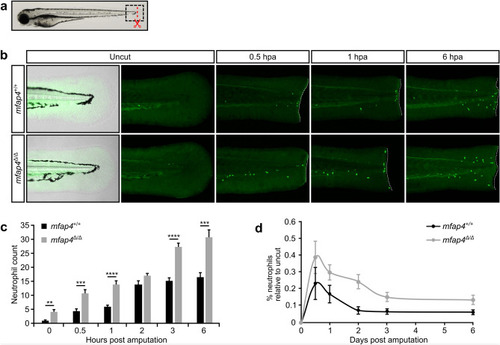
Neutrophil recruitment to the amputation site is increased in mfap4 mutant fish. (a) The tail fin primordium of 3 dpf wild-type (WT, mfap4+/+) or mfap4∆/∆ mutant larvae was amputated (red line) and subsequently analyzed by whole-mount immunofluorescence with the neutrophil marker mpx (black box). (b) Representative images of various time points post amputation of WT and mfap4∆/∆ fins. White dotted lines outline the amputation site. (c) Graphical representation of mean neutrophil numbers in the imaged area near the amputation site [as shown in (b)] of ten biological replicates per genotype for various time points post amputation. Quantification of neutrophil numbers reveals significantly more neutrophils are recruited to the amputation site in mfap4∆/∆ mutants as compared to WT larvae at most analyzed time points (0 hours post amputation (hpa), P = 0.0021; 0.5 hpa, P = 0.0002; 1 hpa, P < 0.0001; 2 hpa, P = 0.1051; 3 hpa, P < 0.0001; 6 hpa; P = 0.0002; assessed by Mann–Whitney-U test). (d) Quantification of neutrophil numbers in the larval tail near the amputation site at the time points shown in (c) relative to uncut tails. The recruitment of neutrophils is not accelerated in mfap4∆/∆ mutants. Error bars in (b) and (c) represent the standard error of the mean (s.e.m.) of ten biological replicates. Graphs in panels (c) and (d) were generated with Microsoft Excel (for Mac 2011, version 14.7.7). This figure was created with Inkscape software version 0.92 (available at https://www.inkscape.org/).

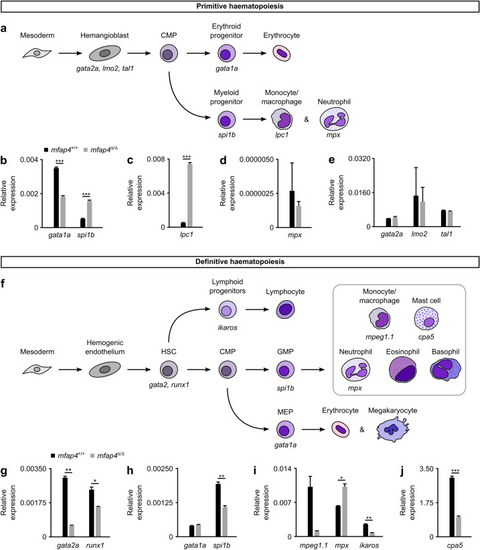
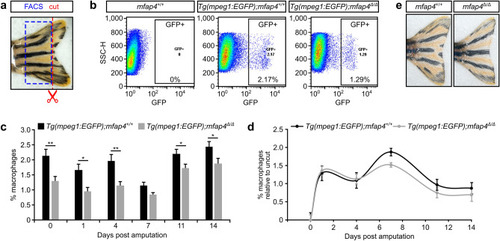
Loss of Mfap4 alters myeloid haematopoiesis in zebrafish. (a) Schematic of the primitive wave of zebrafish haematopoiesis (reviewed in47,48). (be) Expression of markers specific to the primitive wave in 10–14 somite stage WT (mfap4+/+) or mutant (mfap4∆/∆) embryos relative to the average expression of housekeeping genes (actb1 and eukaryotic translation elongation factor 1 alpha 1, like 1 (eef1a1)). In mutants, gata1a expression is significantly reduced (P = 0.000157; Student’s t-test), while expression of spi1b and lpc1 (P = 0.000147 and P = 0.000515, respectively; Student’s t-test) are increased. Expression of mpx, gata2a (P = 0.7 for both; Mann–Whitney-U test), lmo2 and tal1 (P = 0.855612 and P = 0.254594, respectively; Student’s t-test) are not significantly affected by loss of Mfap4. (f) Schematic of the definitive wave of zebrafish haematopoiesis (reviewed in47,48). (gj) Expression of markers specific to the definitive wave in 7-day-old WT or mutant larvae, relative to the average expression of housekeeping genes (actb1 and eef1a1). At 7 dpf, expression of gata2a, runx1 and spi1b (P = 0.001146, P = 0.02048, and P = 0.002625, respectively; Student’s t-test) is significantly reduced. Expression of gata1a at 7 dpf is unaffected by Mfap4 loss (P = 0.136085; Student’s t-test). Expression of mpeg1.1 is considerably, yet not significantly, reduced in mutants (P = 0.1; Mann–Whitney-U test). Expression of mpx is significantly increased in mutants (P = 0.022413; t-test), while ikaros and cpa5 expression is significantly reduced (P = 0.001643 and P = 0.000204, respectively; Student’s t-test). Error bars represent the standard error of the mean (s.e.m.) of technical triplicates of twenty pooled embryos/larvae per genotype per time point. Abbreviations: HSC, hematopoietic stem cell; CMP, common myeloid progenitor; MEP, megakaryocyte/erythroid progenitor; GMP, granulocyte/macrophage progenitor. Graphs in panels (be) and (gj) were generated with Microsoft Excel (for Mac 2011, version 14.7.7). This figure was created with Inkscape software version 0.92 (available at https://www.inkscape.org/).

Acknowledgments
This image is the copyrighted work of the attributed author or publisher, and ZFIN has permission only to display this image to its users. Additional permissions should be obtained from the applicable author or publisher of the image. Full text @ Sci. Rep.