IMAGE

Figure 2

ID
ZDB-IMAGE-200720-16
Genes
Source
Figures for Ong et al., 2020
Image
Figure Caption

Figure 2

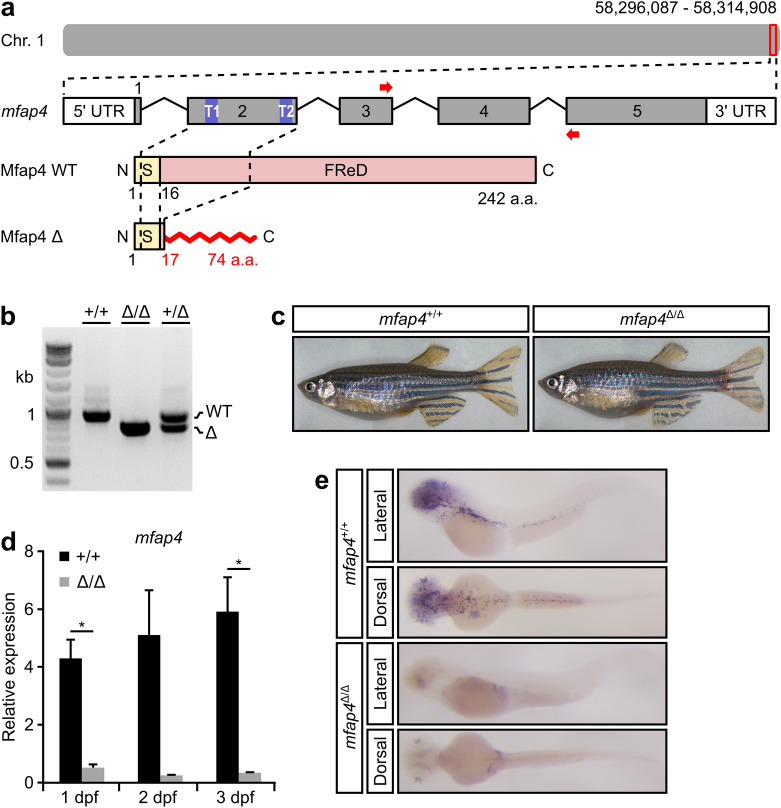
Generation of a loss-of-function mutation in zebrafish mfap4. (a) Guide RNA target sites (T1 and T2, in blue) in exon 2 for CRISPR/Cas9 gene editing of the zebrafish mfap4 genomic locus. The resulting 150 base pair (bp) deletion is predicted to generate a truncated 74 amino acid (a.a.) protein product, p.S17Rfs58X. Abbreviations: FReD, fibrinogen-related domain; C, C-terminal; Chr, Chromosome; N, N-terminal; S, signal peptide. (b) Genotyping analysis of wild-type (WT, +/+) and mfap4 heterozygous (+ /∆) and homozygous (∆/∆) mutants. The WT amplicon length is 946 bp and the mutant amplicon length is 795 bp (see Materials and Methods for additional details). The full gel image can be found in Fig. S5. (c) Representative images of 4-month-old WT and mfap4∆/∆ fish. (d) Quantitative RT-PCR analysis with primers indicated in panel (a) by red arrows relative to actb1 reveals that the mutant mfap4 transcript is barely detectable (significant at 1 dpf (P = 0.029612) and 3 dpf (P = 0.041617), but not at 2 dpf (P = 0.084486); assessed by Student’s t-test), which suggests the mfap4p.S17Rfs58X mutant transcript is degraded. Error bars represent the standard error of the mean (s.e.m.) of technical triplicates of 20 pooled embryos per genotype per time point. (e) Whole-mount in situ hybridization of mfap4 in WT and mfap4∆/∆ larvae at 3 days post fertilization. The graph in panel (d) was generated with Microsoft Excel (for Mac 2011, version 14.7.7). This figure was created with Inkscape software version 0.92 (available at https://www.inkscape.org/).

Figure Data
Acknowledgments
This image is the copyrighted work of the attributed author or publisher, and ZFIN has permission only to display this image to its users. Additional permissions should be obtained from the applicable author or publisher of the image. Full text @ Sci. Rep.