FIGURE SUMMARY
Title

Hyaloid vasculature and mmp2 activity play a role during optic fissure fusion in zebrafish

Authors
Weaver, M.L., Piedade, W.P., Meshram, N.N., Famulski, J.K.
Source
Full text @ Sci. Rep.

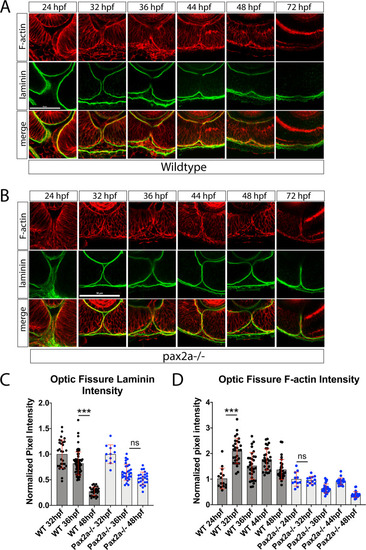
An increase in F-actin dynamics preceding laminin degradation during optic fissure fusion is disrupted in pax2a−/− embryos. (A) Whole mount immunohistochemistry was used to simultaneously visualize F-actin (red) and laminin (green) during OF fusion, 24-72 hpf. Central-proximal sections obtained using confocal imaging were collected and quantified. Scale bar = 50 μm. (B) Whole mount Immunohistochemistry was used to simultaneously visualize F-actin (red) and laminin (green) during OF fusion, 24-72 hpf, in pax2−/− embryos. Central-proximal regions of the OF are displayed. Scale bar = 50 μm. (C) Quantification of laminin signal intensity within the OF, normalized to regions of laminin staining juxtaposed to the lens. Relative pixel intensities are displayed. ANOVA p < 0.0001. (D) Quantification of F-actin intensity (phalloidin staining) within the OF, normalized to regions of F-actin signal within the lobe of the retina. Relative pixel intensities are displayed. ANOVA p < 0.0001.

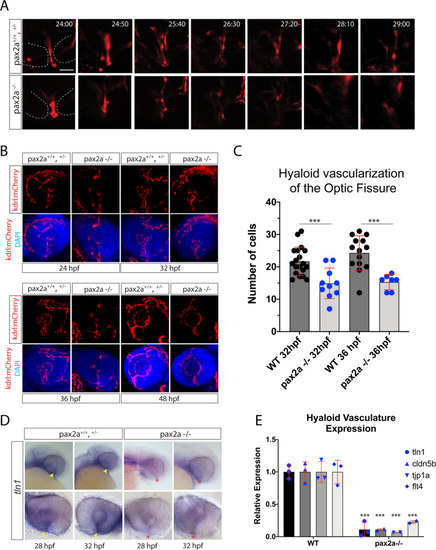
Pax2a is necessary for recruitment of hyaloid vasculature into the optic fissure. (A)In vivo 4D confocal imaging of Tg[kdrl:mCherry] pax2a+/+,+/− or pax2a−/− embryos. Time lapse series depicting the region of the OF (dotted white lines) and mCherry positive vasculature endothelial cells migrating through the fissure from 24-29 hpf. Scale bar = 10 μm. (B) Comparison of pax2a+/+,+/− and pax2a−/− vascularization during OF fusion, 24-48 hpf. 3D reconstructions of whole mount Tg[kdrl:mCherry] (red) pax2a+/+,+/− or pax2a−/− embryos with DAPI (blue) stained DNA. Scale bar = 50 μm. (C) Quantification of the number of mCherry positive cells from 3D confocal stacks within the region of the OF. Individual embryo results are depicted. ANOVA p < 0.0001. (D) Whole mount in situ hybridization comparing tln1 expression between pax2a+/+,+/− and pax2a−/− embryos at 28 and 32 hpf. tln1 signal within the OF (yellow arrowhead) appears reduced in Pax2a−/− embryos (red *). (E) qPCR analysis of tln1 expression from heads of pax2a+/+ and pax2a−/− embryos at 32 hpf confirms a reduction in tln1 expression.

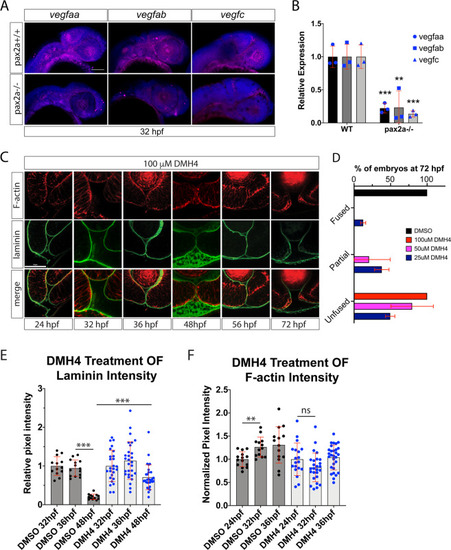
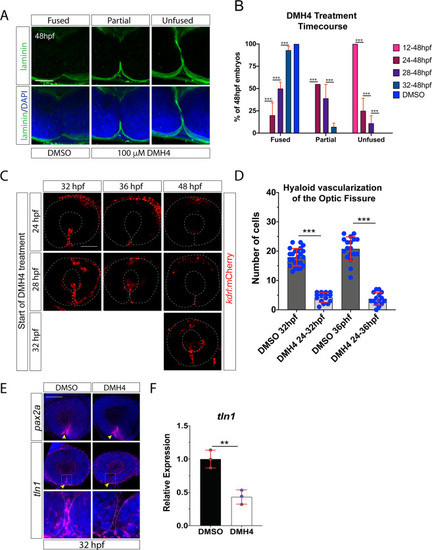
Inhibiting angiogenesis disrupts optic fissure fusion mechanics. (A) Fluorescent whole mount in situ hybridization of vegfaa, vegfab and vegfc at 32 hpf in WT and pax2a−/− embryos. Loss of pax2a results in decreased vegfaa, ab and c expression. DAPI is depicted in blue. Scale bar = 100 μm. (B) qPCR results for vegfaa, vegfab and vegfc expression from heads of pax2a+/+ and pax2a−/− embryos at 32 hpf. (C) 3D confocal images of Tg[kdrl:mCherry] (red) embryos treated with 100 μM DMH4 between 24-72 hpf. DNA was stained with DAPI (blue). Scale bar = 50 μm. (D) Quantification of 48 hpf DMH4 treated embryos for fissure fusion (absence of laminin signal), partial fusion (partial retention of laminin) or failure to fuse (retention of laminin throughout the fissure). n = 22 (DMSO), 52 (100 μM), 22 (50 μM), 24 (25 μM) ANOVA p < 0.0001. (E) Quantification of laminin signal intensity within the central-proximal region of the OF, normalized to regions of laminin staining juxtaposed to the lens. Relative pixel intensities are displayed. ANOVA p < 0.0001. (F) Quantification of F-actin signal intensity (phalloidin staining) within the central-proximal region of the OF, normalized to regions of F-actin signal within the lobe of the retina. Relative pixel intensities are displayed. ANOVA p < 0.0001.

VEGF signaling is plays a role in optic fissure fusion. (A) Whole mount Immunohistochemistry was used to visualize laminin (green) at 48 hpf after DMSO or DMH4 treatment. Central-proximal regions of the OF are displayed depicting fused, partially fused or unfused optic fissures. Scale bar = 50 μm. (B) Quantification of 48 hpf DMH4 treated embryos for fissure fusion (absence of laminin signal), partial fusion (partial retention of laminin) or failure to fuse (retention of laminin throughout the fissure). n = 41(12-48 hpf), 38(24-48 hpf), 38(28-48 hpf), 44(32-48 hpf), 40 (DMSO). ANOVA p < 0.0001. (C) 3D reconstructions of whole mount Tg[kdrl:mCherry] embryos treated with 100 μM DMH4 at various time points. Broken white line outlines the retina. Scale bar = 50 μm. (D) Quantification of the number of mCherry positive cells from 3D confocal stacks within the region of the OF after DMSO or DMH4 treatment. Individual embryo results are depicted. ANOVA p < 0.0001. (E) Fluorescent whole mount in situ hybridization of pax2a or tln1 probe at 32 hpf in DMSO or DMH4 treated embryos. OF expression is indicated with a yellow arrowhead. DMH4 treatment does not appear to alter pax2a expression but eliminates tln1 expression from the OF. Broken white lines outline the retinal lobes. Scale bar = 50 μm (F) qPCR results for tln1 expression in DMH4 treated embryos.

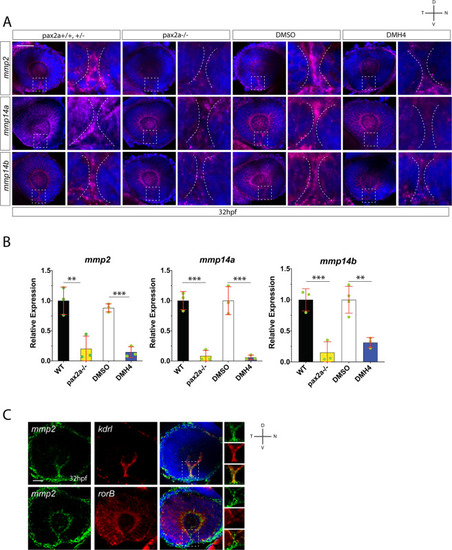
Hyaloid vasculature is a source of mmp2 during optic fissure fusion. (A) Fluorescent whole mount in situ hybridization comparing mmp2, mmp14a and mmp14b expression in WT vs pax2a−/− and DMSO vs DMH4 treated embryos at 32 hpf. Broken white lines outline the OF retinal lobes. mmp2, 14a and 14b expression within the OF is reduced in pax2a−/− and DMH4 treated embryos. Scale bar = 50 μm. (B) qPCR analysis confirms a decrease in expression of mmp2, 14a and 14b in both pax2a−/− and DMH4 treated embryos. (C) Two color whole mount in situ hybridization simultaneously examining mmp2 and kdrl, or mmp2 and rorB expression at 32 hpf. DNA was stained with DAPI. Scale bar = 50 μm. Clear overlap of signal is observed for mmp2 and kdrl, but not mmp2 and rorB.

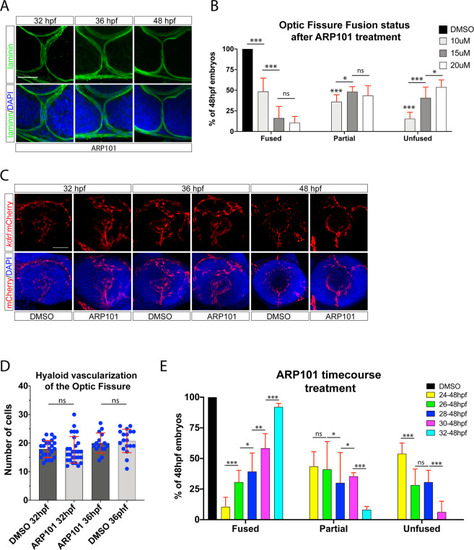
Proper timing of mmp2 activity is required for optic fissure fusion. (A) Whole mount Immunohistochemistry was used to visualize laminin (green) and DAPI (blue) in ARP101 treated Tg[rx3:GFP] embryos at 32, 36 and 48 hpf. Stacks of central-proximal regions of the OF are displayed. Scale bar = 50 μm. (B) Quantification of 48 hpf ARP101 treated embryos for fissure fusion (absence of laminin signal), partial fusion (partial retention of laminin) or failure to fuse (retention of laminin throughout the fissure). n = 41 (10 μM), 38 (15 μM), 42 (20 μM) ANOVA p < 0.0001. (C) 3D reconstructions of whole mount Tg[kdrl:mCherry] (red) embryos treated with 20 μM ARP101 from 24-32, 36 or 38 hpf. DNA was stained with DAPI (blue). Scale bar = 50 μm. (D) Quantification of the number of mCherry positive cells from 3D confocal stacks within the region of the OF after DMSO or 20 μM ARP101 treatment. Individual embryo results are depicted. (E) Quantification of 48 hpf ARP101 treated embryos for fissure fusion, partial fusion or failure to fuse after various treatment initiation times from 24-32 hpf. n = 42 (24-48 hpf), 29 (26-48 hpf), 29 (28-48 hpf), 23 (30-48 hpf), 37 (32-48 hpf). ANOVA p < 0.0001.

Acknowledgments
This image is the copyrighted work of the attributed author or publisher, and ZFIN has permission only to display this image to its users. Additional permissions should be obtained from the applicable author or publisher of the image. Full text @ Sci. Rep.