
- Title
-
ube3d, a New Gene Associated with Age-Related Macular Degeneration, Induces Functional Changes in Both In Vivo and In Vitro Studies
- Authors
- Xia, H., Zhang, Q., Shen, Y., Bai, Y., Ma, X., Zhang, B., Qi, Y., Zhang, J., Hu, Q., Du, W., Zhu, L., Zhou, P., Wang, B., Xu, H., Huang, L., Li, X.
- Source
- Full text @ Mol Ther Nucleic Acids
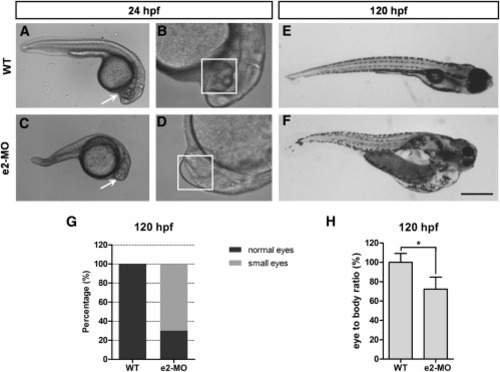
Knockdown of ube3d Delays Zebrafish Eye Development and Reduces Eye Size (A) Live images of WT 24-hpf larvae. (B Enlargement of (A) with the 3.2 magnification. (C) Live images of e2-MO 24-hpf larvae. (D) Enlargement of (C) with the 3.2 magnification. (E) Live images of WT 120-hpf larvae. (F) Live images of e2-MO 120-hpf larvae. (G) At 120 hpf, the percentage of small eyes in e2-MO larvae was significantly higher than the percentage in WT larvae. (H) At 120 hpf, eye size in e2-MO larvae was significantly smaller than eye size in WT larvae. The data are presented as the mean ± SD. ∗p < 0.05. Scale bars represent 400 μm (A and C), 125 μm (B and D), and 500 μm (E and F). |
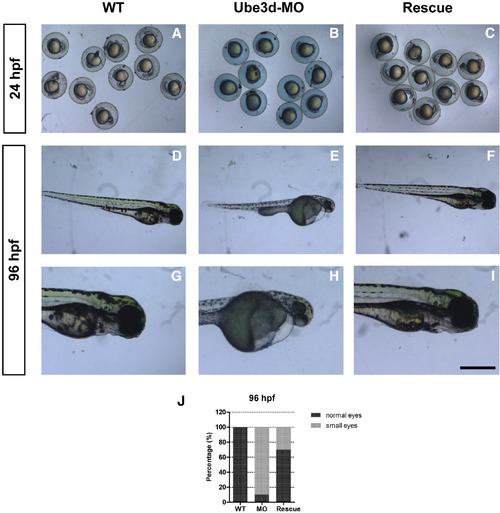
Rescue of ube3d Morphants (A–C) (A) Live images of 24 hpf WT; (B) Live images of 24 hpfMO; (C) Live images of rescue 24-hpf larvae. (D–I) (D and G) Live images of 96 hpf WT; (E and H) Live images of 96 hpf MO; (F and I) Live images of Rescue 96-hpf larvae. (G) Enlargement of (D), (H) Enlargement of (E), (I) Enlargement of (F). (J) At 96 hpf, the ube3d MO embryos were partially rescued by coinjection with human ube3d mRNA, and the percentage of small eyes in the rescued larvae was significantly lower than the percentage in MO larvae. |
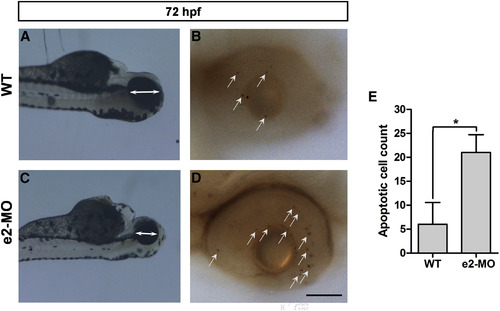
Knockdown of ube3d Causes Increases Cell Death in the Eye (A) TUNEL staining revealed few apoptotic cells (arrows) in the eyes of WT 72-hpf larvae. (B) Enlargement of (A). (C) TUNEL staining revealed an increase in apoptotic cells (arrows) in the eyes of e2-MO 72-hpf larvae. (D) Enlargement of (C). (E) A graphical representation demonstrating that the number of apoptotic cells in e2-MO 72-hpf larvae (21.0 ± 2.2) was significantly higher than the number in WT larvae (6.0 ± 2.6). The data are presented as the mean ± SD. ∗p < 0.05. Scale bars represent 250 μm (A and C) and 70 μm (B and D). PHENOTYPE:
|
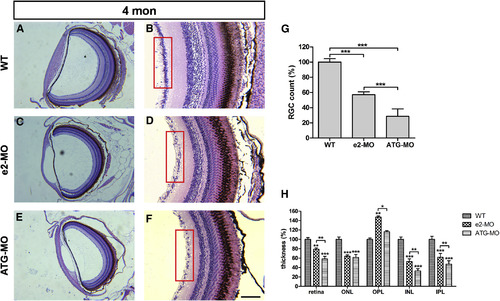
Knockdown of ube3d Results in Retinal Degeneration in Adult Zebrafish (A) Hematoxylin and eosin (H&E) staining of transverse retinal paraffin sections through WT zebrafish eyes at 4 months old. (B) enlargement of (A). (C) H&E staining of transverse retinal paraffin sections through e2-MO ube3d morphant eyes at 4 months old. (D) Enlargement of (C). (E) H&E staining of transverse retinal paraffin sections through ATG-MO ube3d morphant eyes at 4 months old. (F) enlargement of (E). (G) A graphical representation demonstrating that the number of retinal ganglion cells was significantly lower in e2-MO and ATG-MO ube3d morphants than the number in WT zebrafish. (H) All layers of the retina in e2-MO and ATG-MO ube3d morphants were significantly thinner than the corresponding layers in WT zebrafish. The red boxes in (B), (D), and (F) indicate the ganglion cell layer. The data are presented as the mean ± SD. ∗p < 0.05, ∗∗p < 0.01, ∗∗∗p < 0.001. Scale bars represent 100 μm (A, C, and E) and 70 μm (B, D, and F). PHENOTYPE:
|
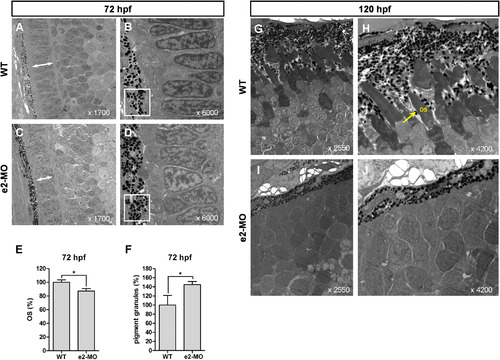
Knockdown of ube3d Results in More Deposited Pigment Granules and an Abnormal Photoreceptor-Outer Segment Layer (A) Transmission electron micrographs of transverse sections cut along the dorsal-ventral axis of WT zebrafish eyes at 72 hpf (with ×1,700 and ×6,000 magnification, as indicated). (B) Enlargement of (A). (C) Transmission electron micrographs of transverse sections cut along the dorsal-ventral axis of e2-MO ube3d morphant eyes at 72 hpf (with ×1,700 and ×6,000 magnification, as indicated). (D) Enlargement of (C). (E) Graphical representation demonstrating that OS (arrow) lengths were shorter in the ube3dmorphants than those in the WT larvae. (F) Graphical representation demonstrating that more pigment granules were deposited in the photoreceptor OS layer in ube3dmorphants than were deposited in WT larvae. (G) Photoreceptor OSs (arrow) were present in WT 120-hpf larvae (with ×2,550 and ×4,200 magnification, as indicated). (H) Enlargement of (G). (I) Photoreceptor OSs were not observed in the ube3d morphants at 120 hpf (with ×1,700 and ×6,000 magnification, as indicated). (J) Enlargement of (I). The data are presented as the mean ± SD. ∗p < 0.05. PHENOTYPE:
|
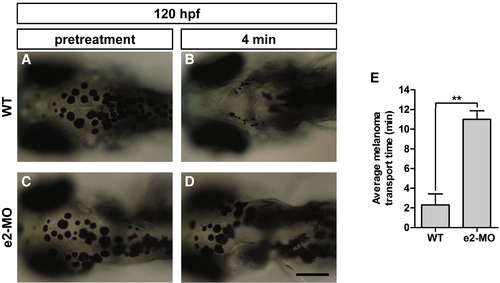
Knockdown of ube3d Results in Delayed Epinephrine-Induced Melanosome Retraction (A and B) WT 120-hpf larvae prior to treatment (A) and at 4 min after exposure to epinephrine (B). (C and D) e2-MO 120-hpf larvae prior to treatment (C) and at 4 min after exposure to epinephrine (D). (E) A graphical representation demonstrating that epinephrine-induced melanosome retrograde trafficking was significantly slower in e2-MO 120-hpf larvae (11.0 ± 0.5 min) than trafficking in WT larvae (2.32 ± 0.64 min). The data are presented as the mean ± SD. ∗∗p < 0.01. PHENOTYPE:
|
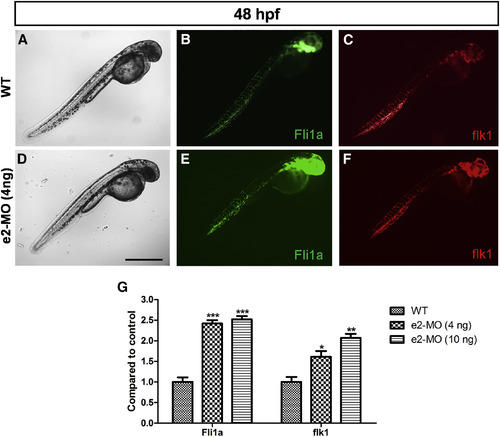
Knockdown of ube3d Promotes Angiogenesis (A–C) Live images (A), Fli1a expression (B), and flk1 expression (C) in WT 48-hpf larvae. (D–F) Live images (D), Fli1a expression (E), and flk1 expression (F) in e2-MO (4 ng) 48-hpf larvae. (G) The expression levels of Fli1a and flk1 were significantly increased in e2-MO 48-hpf larvae. The data are presented as the mean ± SD. ∗p < 0.05, ∗∗p < 0.01, ∗∗∗p < 0.001. Scale bar represents 500 μm. |
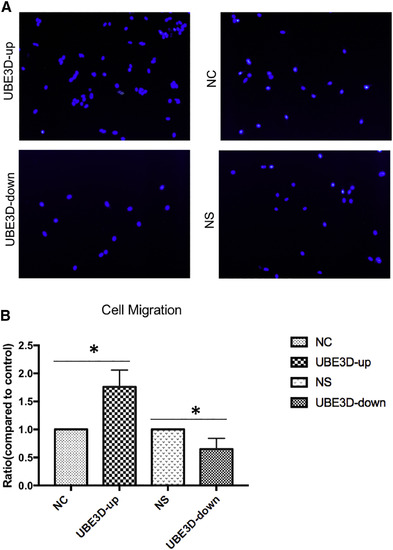
Effect of UBE3D on the Migration of hRPE Cells (A) shows RPE through Boyden upper compartment (DAPI staining, RPE-colored nuclei through the compartment as seen under fluorescence microscopy). (B) Statistical results. The migratory activities of cell lines were estimated based on the numbers of cells that had migrated through the filter of the chamber. The numbers of migrating cells in the UBE3D-overexpressing group were greater than those observed in the lentiviral vector control group. The numbers of migrating cells in the low-UBE3D-expressing group were lower than those observed in the lentiviral nonspecific control group (∗p < 0.05). |
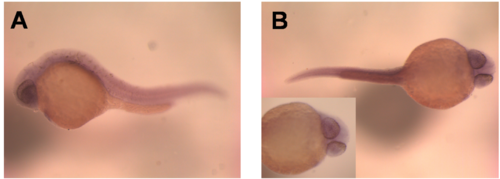
The spatial specificity of ube3d expression in Zebrafish. (A) Side bitmap of ube3d expression in Whole embryo in situ hybridization (WISH) of 24 hpf wild-type zebrafish. (B)Supine bitmap of ube3d expression in Whole embryo in situ hybridization (WISH) of 24 hpf wild-type zebrafish |
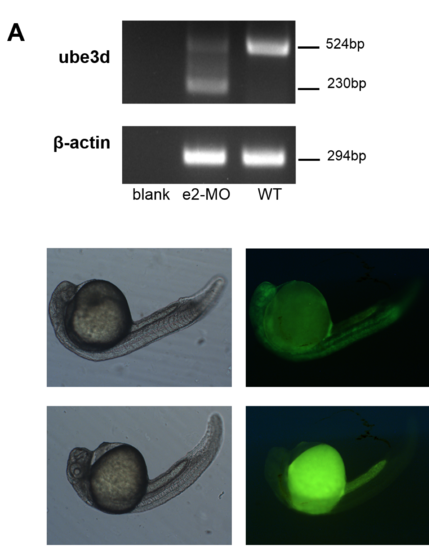
Verification of the ube3d knockout efficiency in zebrafish. (A)RT-PCR was used to measure ube3d expression in 24 hpf wild-type zebrafish、e2 MO ube3d-knockdown zebrafish and blank control group (under normal circumstances, the length of ube3d is 524bp; due to the deletion length of exon 2 of ube3d, the length of e2 MO ube3d-knockdown zebrafish change to be 230bp). The following figure at right shows the bright field morphology of wild-type 24hpf and ATG-MO ube3d-knockdown zebrafish;the following figure on the left shows the expression of the ATG- MO target sequence (green fluorescence table) in the wild-type 24hpf and the ATG-MO zebrafish. |

ZFIN is incorporating published figure images and captions as part of an ongoing project. Figures from some publications have not yet been curated, or are not available for display because of copyright restrictions. PHENOTYPE:
|