
Fig. S2
- ID
- ZDB-IMAGE-200605-30
- Publication
- Xia et al., 2020 - ube3d, a New Gene Associated with Age-Related Macular Degeneration, Induces Functional Changes in Both In Vivo and In Vitro Studies
- All Figures
- Figures for Xia et al., 2020
|
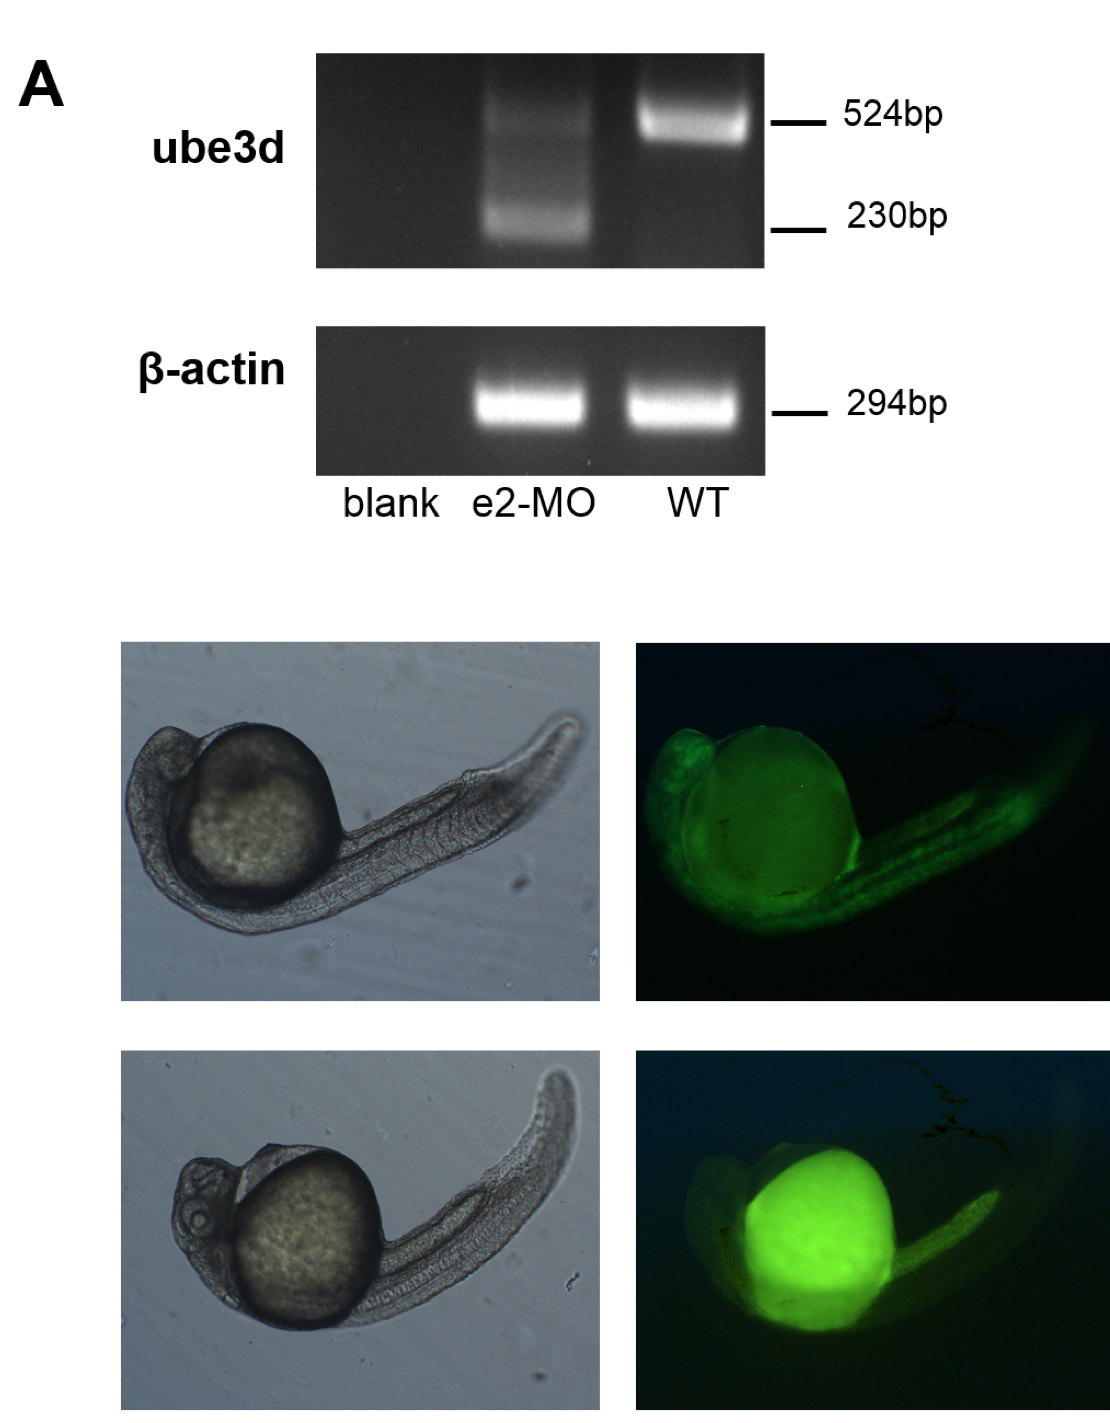
Fig. S2
Verification of the ube3d knockout efficiency in zebrafish.
(A)RT-PCR was used to measure ube3d expression in 24 hpf wild-type zebrafish、e2 MO ube3d-knockdown zebrafish and blank control group
(under normal circumstances, the length of ube3d is 524bp; due to the deletion length of exon 2 of ube3d, the length of e2 MO ube3d-knockdown zebrafish change to be 230bp). The following figure at right shows the bright field morphology of wild-type 24hpf and ATG-MO ube3d-knockdown
zebrafish;the following figure on the left shows the expression of the ATG-
MO target sequence (green fluorescence table) in the wild-type 24hpf and the ATG-MO zebrafish.