
|
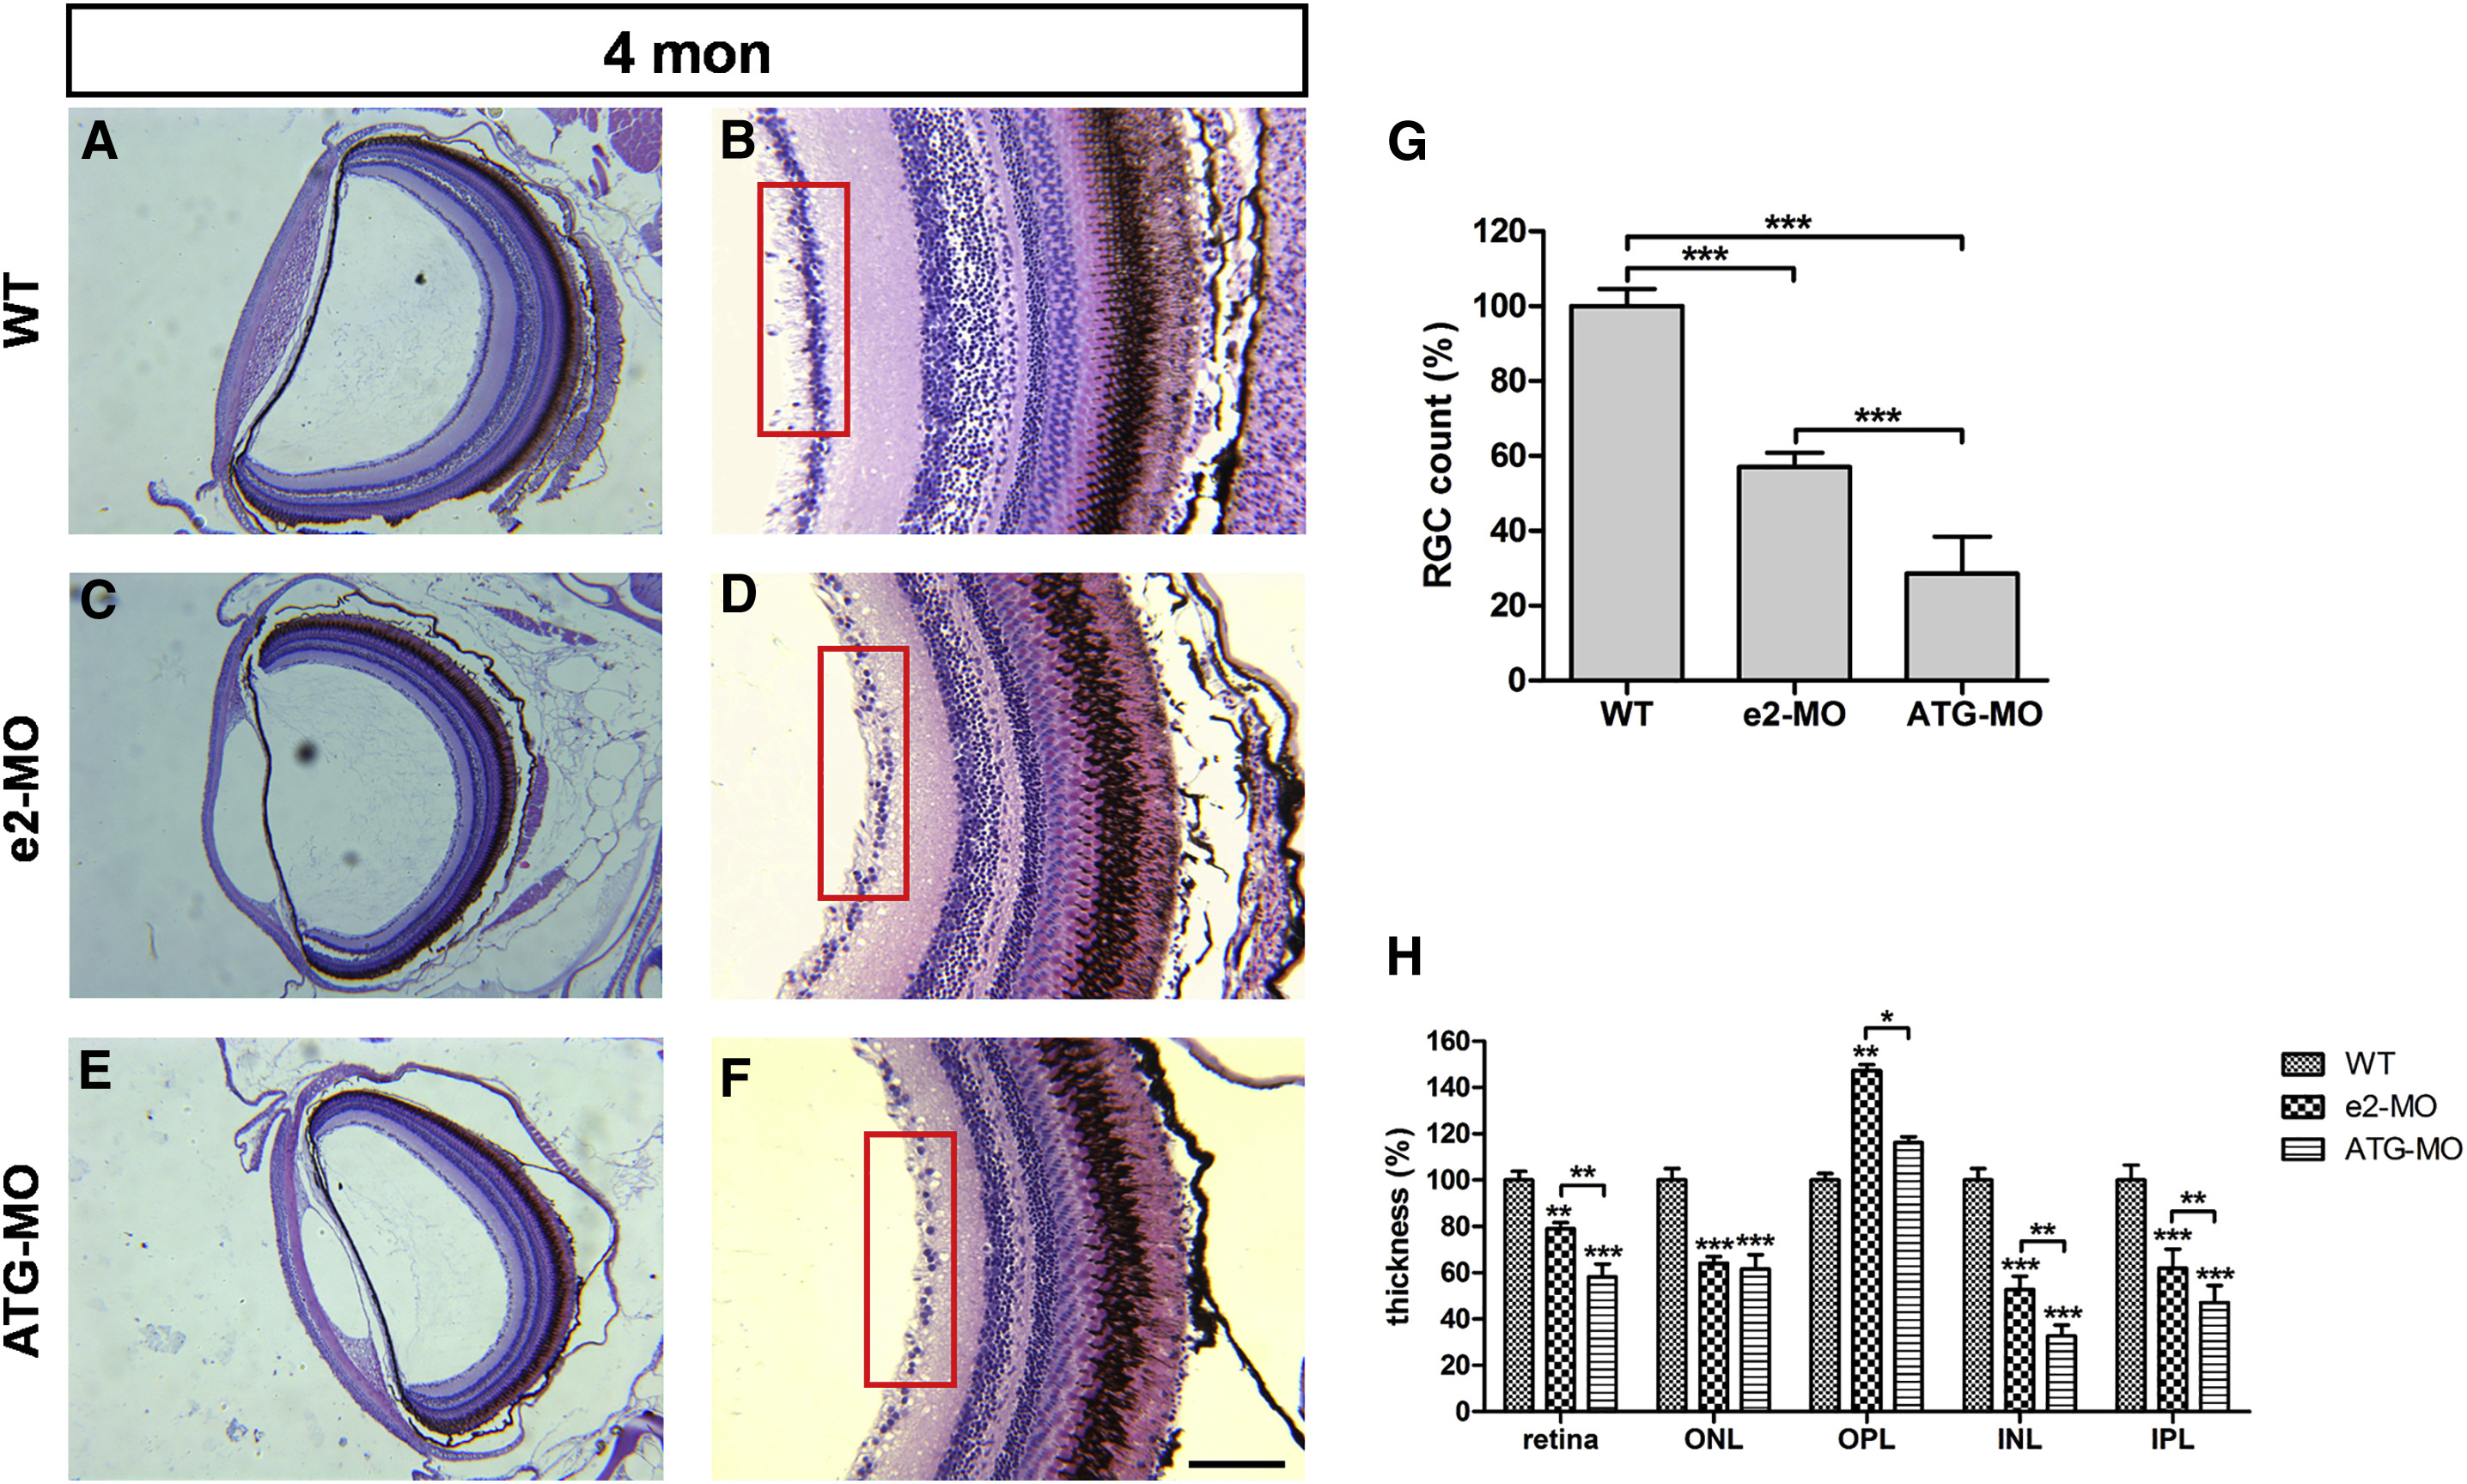
Fig. 4
Knockdown of ube3d Results in Retinal Degeneration in Adult Zebrafish
(A) Hematoxylin and eosin (H&E) staining of transverse retinal paraffin sections through WT zebrafish eyes at 4 months old. (B) enlargement of (A). (C) H&E staining of transverse retinal paraffin sections through e2-MO ube3d morphant eyes at 4 months old. (D) Enlargement of (C). (E) H&E staining of transverse retinal paraffin sections through ATG-MO ube3d morphant eyes at 4 months old. (F) enlargement of (E). (G) A graphical representation demonstrating that the number of retinal ganglion cells was significantly lower in e2-MO and ATG-MO ube3d morphants than the number in WT zebrafish. (H) All layers of the retina in e2-MO and ATG-MO ube3d morphants were significantly thinner than the corresponding layers in WT zebrafish. The red boxes in (B), (D), and (F) indicate the ganglion cell layer. The data are presented as the mean ± SD. ∗p < 0.05, ∗∗p < 0.01, ∗∗∗p < 0.001. Scale bars represent 100 μm (A, C, and E) and 70 μm (B, D, and F).