
Image
|
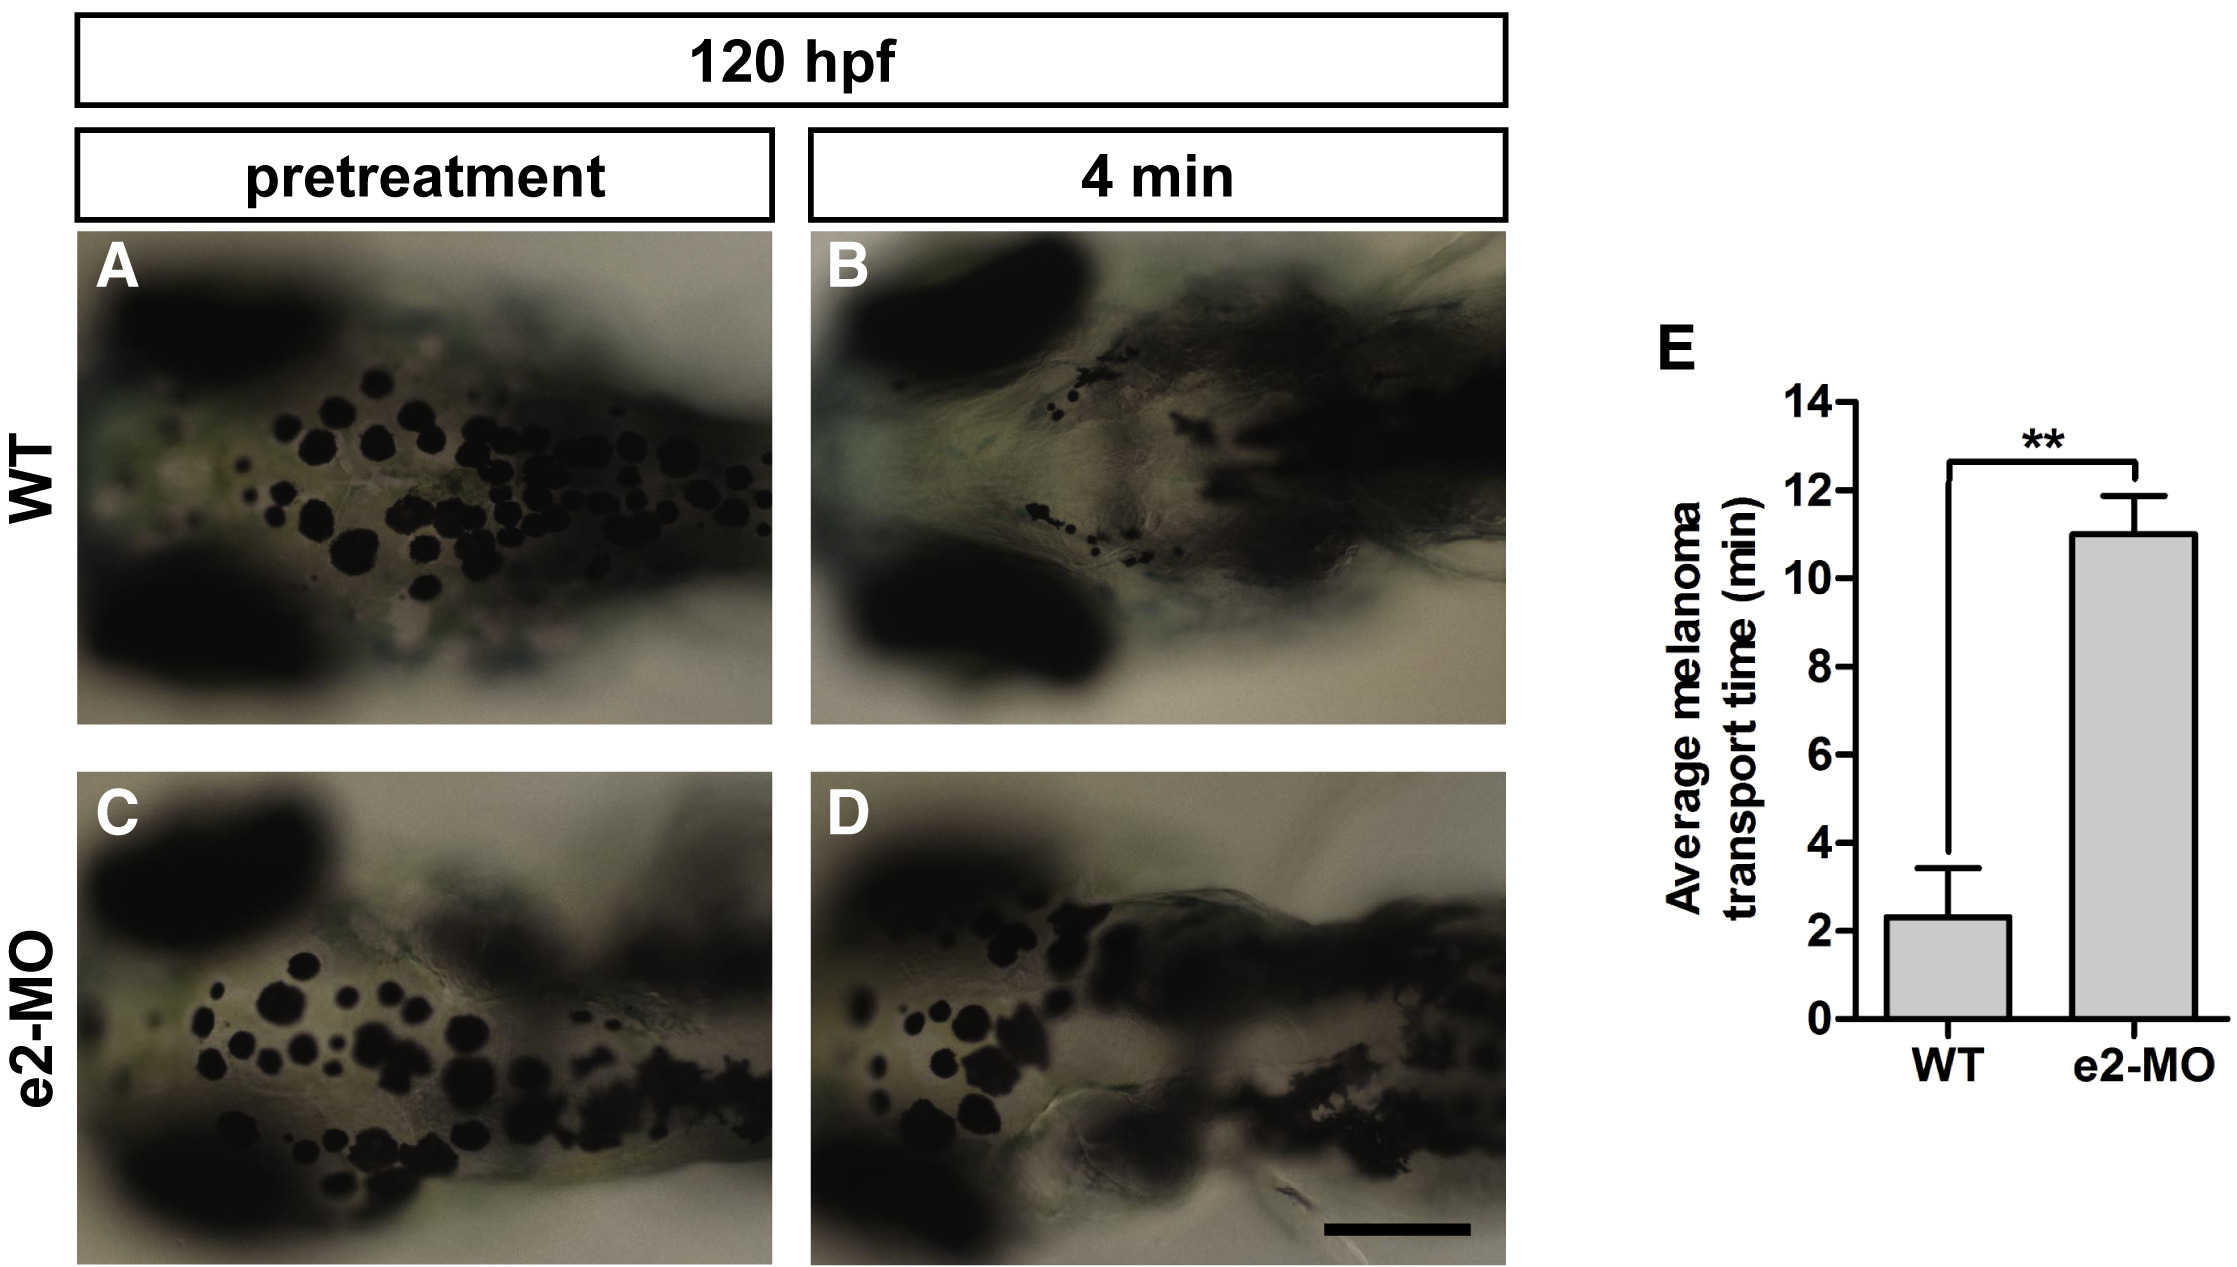
Figure Caption
Fig. 6
Knockdown of ube3d Results in Delayed Epinephrine-Induced Melanosome Retraction
(A and B) WT 120-hpf larvae prior to treatment (A) and at 4 min after exposure to epinephrine (B). (C and D) e2-MO 120-hpf larvae prior to treatment (C) and at 4 min after exposure to epinephrine (D). (E) A graphical representation demonstrating that epinephrine-induced melanosome retrograde trafficking was significantly slower in e2-MO 120-hpf larvae (11.0 ± 0.5 min) than trafficking in WT larvae (2.32 ± 0.64 min). The data are presented as the mean ± SD. ∗∗p < 0.01.
Figure Data
Acknowledgments
This image is the copyrighted work of the attributed author or publisher, and
ZFIN has permission only to display this image to its users.
Additional permissions should be obtained from the applicable author or publisher of the image.
Full text @ Mol Ther Nucleic Acids