
- Title
-
Dynamic Buffering of Extracellular Chemokine by a Dedicated Scavenger Pathway Enables Robust Adaptation during Directed Tissue Migration
- Authors
- Wong, M., Newton, L.R., Hartmann, J., Hennrich, M.L., Wachsmuth, M., Ronchi, P., Guzmán-Herrera, A., Schwab, Y., Gavin, A.C., Gilmour, D.
- Source
- Full text @ Dev. Cell
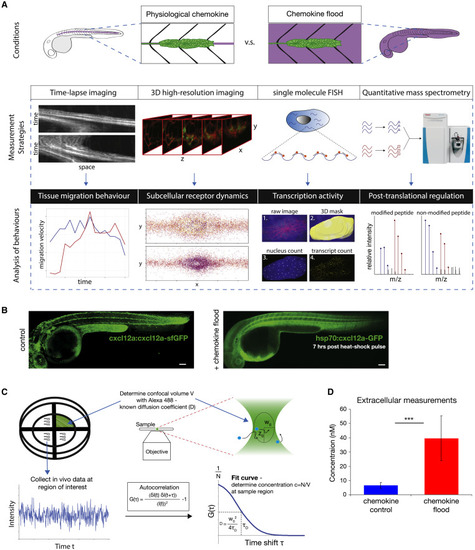
An Experimental Framework to Study Robustness of Tissue Migration in Response to Changing Chemokine Concentration In Vivo (A) Experimental adaptation framework. (B) cxcl12a:cxcl12a-tagRFP-sfGFP (left) and hsp70:cxcl12a-GFP (right) embryos at 7 h after heat-shock induction. Scale bars, 100 μm. (C) Schematic for image acquisition and FCS analysis (see STAR Methods). (D) Bar charts (mean and standard deviation) of inferred in vivo chemokine concentrations in control (n = 50) and chemokine flood (n = 42) at 7 h post-induction. Statistics: ∗∗∗p < 0.001. |
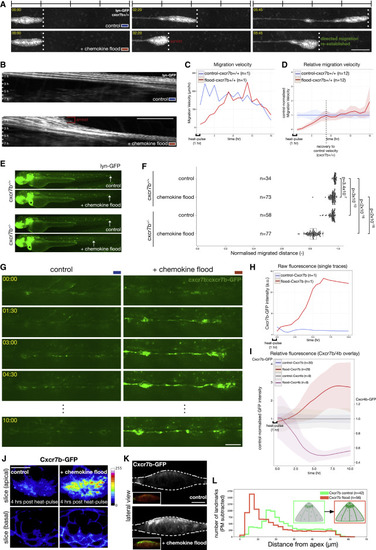
Tissue Migration Rapidly Adapts to a Chemokine Flood, a Response that Is Sensitive to Cxcr7b Levels (A and B) Time lapse of lateral line migration (cldnB:lyn-GFP) in cxcr7b+/+ embryos in control (top: temperature shifted without hsp70:mCherry-cxcl12a transgene) and chemokine flood (bottom: after induction of hsp70:mCherry-cxcl12a) (A) and corresponding kymographs (B). Scale bars, 100 μm (A) and 50 μm (B). Timescale 1 h per bar. See Video S1A. (C) Lateral line migration velocity over time (h post-heat shock); control (blue) and chemokine flood (red). (D) Migration velocity in chemokine flood (n = 12, red) relative to the mean of control (n = 12, blue). Shadings, standard deviations. (E) Migration in cxcr7b+/+ or cxcr7b+/− embryos 24 h after chemokine flood. hsp70:mCherry-cxcl12a transgenics distinguished by the green heart marker (clmc2:GFP, asterisk). (F) Boxplot, median, and quantiles of normalized distance migrated. Statistics: p values indicated on the plot. (G) Time lapse of the Cxcr7b-GFP-expressing lateral line in control (left) or chemokine flood (right). Scale bar, 50 μm. See Video S2. (H) Cxcr7b-GFP fluorescence intensity over time, control (blue) and chemokine flood (red). (I) Cxcr7b-GFP and Cxcr4b-GFP intensities in chemokine flood relative to the mean of the control over time. Cxcr7b-GFP n = 30 and 29 and Cxcr4b-GFP n = 9 and 9. (J) Images of Cxcr7b-GFP in control (left) or chemokine flood (right). Single optical slices allow intensity comparison (calibration bar, signal intensity). Scale bar, 10 μm. (K) Lateral views of (J). Insets: Cxcr7b-GFP with PM label (krt15:lyn-RFP). Scale bar, 10 μm. (L) Quantification of the distance of local fluorescence point densities from tissue apex in control and chemokine flood. |
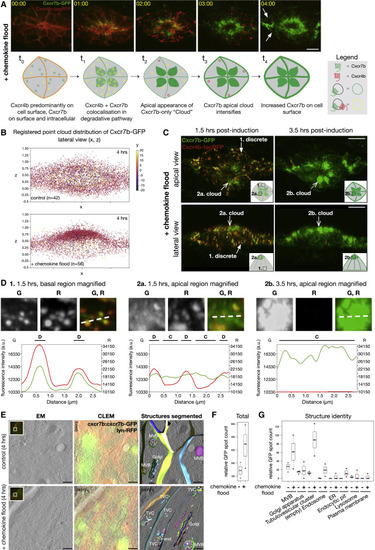
Cxcr7b Upregulation Is Characterized by a Degradation-to-Recycling Trafficking Switch (A) Time lapse of Cxcr7b-GFP and Cxcr4b-tagRFP in chemokine flood (top). Arrows: Cxcr7b-GFP on the PM. Schematic of Cxcr7b-GFP and Cxcr4b-tagRFP trafficking itineraries in chemokine flood (bottom). Scale bar, 10 μm. See Video S4. (B) Registered point cloud 2D scatterplots of Cxcr7b-GFP intensity distributions in control (top) and chemokine flood (bottom). n = 42 and 56. (C) Cxcr7b-GFP/Cxcr4b-tagRFP after indicated times post-induction of chemokine flood. Apical (top) and lateral (bottom) views. Closed arrows, discrete signals and open arrows, non-discrete cloud-like signals. Scale bar, 10 μm. (D) Intensity line profiles to compare trafficking behaviors of Cxcr7b-GFP and Cxcr4b-tagRFP from the indicated regions and times. D, discrete and C, cloud. (E) CLEM of Cxcr7b-GFP and krt15:lyn-RFP in control (top) or chemokine flood (bottom). From left: EM, single slice from an EM tomogram; CLEM, overlay of EM with on section light microscopy (LM); segmented structures, overlay of segmented GFP-positive organelles; and RFP-positive PM with EM. Insets, on-section LM and boxes, targeted regions where EM was acquired. G, Golgi apparatus; MVB, multivesicular body; TVC, tubulovesicular cluster; end, endocytic pit. Scale bars, 1 μm. See Video S5. (F) Relative GFP spot counts as total divided by tomogram volume. Biological repeats = 3. Number of structures: control n = 85, 98, and 43 and chemokine flood n = 31, 128, and 175. (G) Relative GFP spot counts per organelle category. |
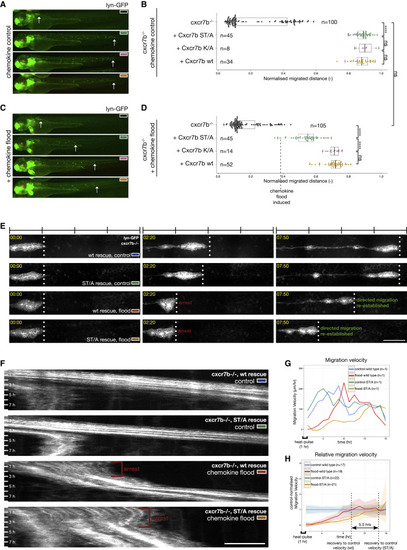
Tissue-Scale Analysis Demonstrates the Requirement for Cxcr7b-Trafficking Switch Regulation for Robust Adaptation during Directed Migration (A) Distance migrated in cxcr7b−/− embryos complemented with Cxcr7b WT, ST/A, or K/A measured at 24 h post-temperature shift. Transgenics distinguished by red eye marker (cry:mKate2). (B) Boxplot, median, and quantiles of normalized distance migrated. Statistics: ∗∗∗∗p < 0.0001; ns, not significant. (C) As in (A), in chemokine flood. hsp70:mCherry-cxcl12a transgenics distinguished by green heart marker (clmc2:GFP). (D) Boxplot, median, and quantiles of normalized distance migrated. Statistics: ns, not significant; ∗∗∗∗p < 0.0001. (E and F) Time lapse of migration in cxcr7b−/− embryos rescued with the indicated Cxcr7b variants in control and chemokine flood (E) and corresponding kymographs (F). Scale bars, 100 μm (E) and 50 μm (F). Timescale 1 h per bar. See Video S8. (G) Lateral line migration velocity over time; control WT, blue; chemokine flood WT, red; control ST/A, green; and chemokine flood ST/A, orange. (H) Migration velocity in chemokine flood (WT n = 19, red and ST/A n = 21, orange) relative to the mean of control (WT n = 17, blue and ST/A n = 22, green). Difference in time required to resume control velocity between flood WT (red) and flood ST/A (orange) as indicated on plot (5.5 h). |
Reprinted from Developmental Cell, 52(4), Wong, M., Newton, L.R., Hartmann, J., Hennrich, M.L., Wachsmuth, M., Ronchi, P., Guzmán-Herrera, A., Schwab, Y., Gavin, A.C., Gilmour, D., Dynamic Buffering of Extracellular Chemokine by a Dedicated Scavenger Pathway Enables Robust Adaptation during Directed Tissue Migration, 492-508.e10, Copyright (2020) with permission from Elsevier. Full text @ Dev. Cell