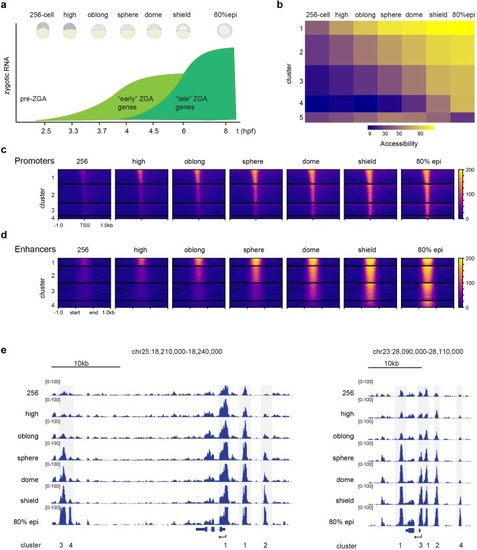
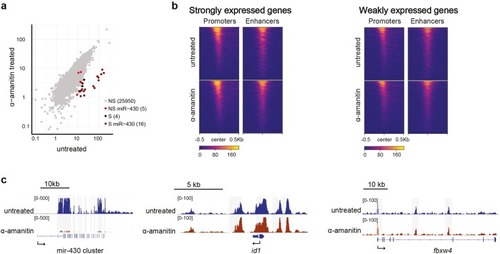
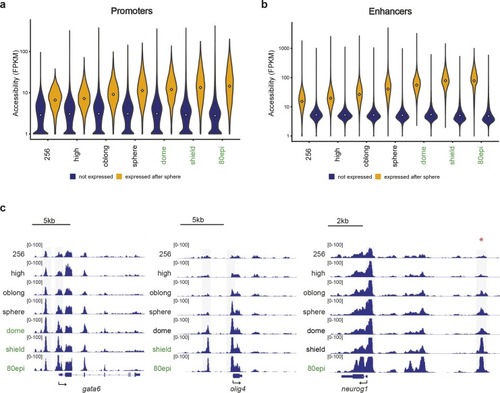
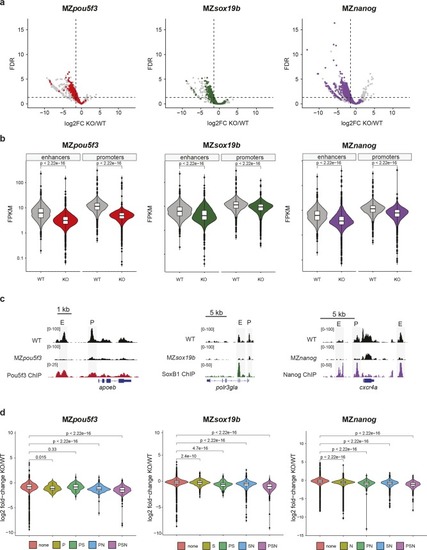
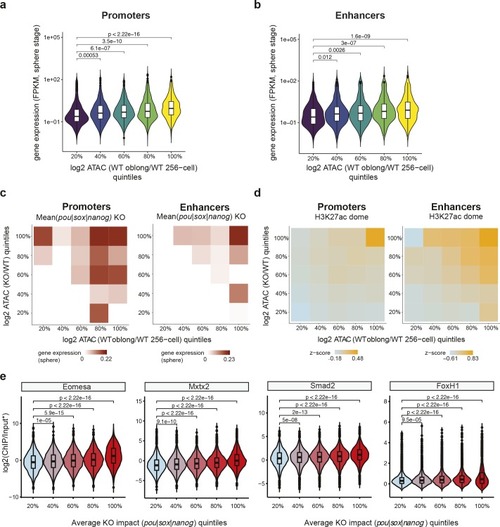
Chromatin accessibility at regulatory elements increases during zygotic genome activation.

a) Schematic of timepoints and embryonic stages chosen for ATAC-seq. “Early” ZGA genes correspond to genes activated until sphere stage and “late” ZGA genes correspond to genes activated after sphere stage. b) Five clusters of chromatin accessibility over the ATAC-seq time-series. c) TSS-centered heatmaps of ATAC-seq peaks in clusters 1 through 4. d) Heatmaps of ATAC-seq peaks centered on putative enhancer regions in clusters 1 through 4. e) Genome browser snapshots of two genomic regions over the ATAC-seq time-series. Peaks belonging to clusters 1–4 are indicated.

Transcription inhibition affects chromatin accessibility only at the miR-430 locus.

a) Correlation dot plot comparing accessibility in α-amanitin-treated embryos with untreated embryos. Significantly (S) and non-significantly (NS) affected peaks (DESeq2 log2 fold change -1.5, 5% FDR), as well as peaks that fall into the miR-430 cluster are indicated. b) Heatmaps of chromatin accessibility in untreated and α-amanitin-treated embryos, grouped based on the expression level of associated genes at sphere stage (expression data taken from [15]; strongly expressed genes are defined as the top 20% genes expressed at sphere stage (RPKM > = 0.419), whereas weakly expressed genes are all other genes (with a minimal expression of RPKM > = 0.004 at sphere stage). c) Genome browser snapshots of untreated and α-amanitin-treated embryos at oblong stage for the hypertranscribed miR-430 gene cluster; id1, a gene with strong zygotic expression; and fbxw4, a gene with weak zygotic expression.

Chromatin accessibility at regulatory elements increases prior to gene activity.

a) Distribution of accessibility values (ATAC-seq FPKM) of promoters associated with genes that become activated after sphere stage (yellow), and genes that are not expressed (blue). White squares represent the median value. b) Distribution of accessibility values of enhancers associated with genes that become activated after sphere stage (yellow), and genes that are not expressed during early development (blue). White squares represent the median value. c) Genome browser snapshots of chromatin accessibility at the gata6, olig4 and neurog1 gene loci; stages at which genes are transcribed are indicated with green fonts, the red asterisk marks an experimentally validated neurog1 enhancer [37].

Pou5f3, Sox19b and Nanog regulate chromatin accessibility at gene regulatory elements.

a) Volcano plots showing the log2 fold change in accessibility in MZpou5f3, MZsox19b and MZnanog mutants compared to wild-type embryos at oblong stage. Sites bound by Pou5f1, SoxB1, and Nanog are indicated in red, green and purple respectively. Non-bound sites are indicated in grey. b) Violin plots show the accessibility value (FPKM) at promoters and putative enhancers in wild-type embryos compared to the respective TF mutants. Significance of differences was tested using paired t-tests. c) Genome browser snapshots show accessibility tracks in MZpou5f3, MZsox19b and MZnanog mutants and wild-type embryos at oblong stage, for target genes of the respective TFs [15,25]. ChIP-seq tracks for the respective TFs at blastula stage are from data in [23,24]. d) Violin plots show the log2 fold change in mutants over wild-type at sites bound by different combinations of Pou5f3, SoxB1 and Nanog. p-values are shown for differences between binding sites as assessed by one-sided Wilcoxon tests.

An increase in chromatin accessibility predicts future gene expression, especially at Pou5f3/Sox19b/Nanog-regulated regions.

a) Promoter regions were sorted into 20% quintiles based on accessibility increase between 256-cell and oblong stage, and violin plots show the expression value of associated genes at sphere stage. p-values are shown for differences in expression between the quintiles as assessed by one-sided Wilcoxon tests. b) Putative enhancer regions were sorted into 20% quintiles based on accessibility increase between 256-cell and oblong stage and violin plots show the expression value of associated genes at sphere stage. p-values are shown for differences in expression between quintiles as assessed by one-sided Wilcoxon tests. c) Heatmaps show the median expression value for genes associated with regulatory regions at sphere stage. Genomic regions are resolved by 20% bins of accessibility increase between 256-cell and oblong stage (x-axis), and 20% bins of accessibility change in MZpou5f3, MZsox19b and MZnanog mutants compared to wild-type embryos at oblong stage (y-axis). d) Heatmaps show the mean z-score normalized H3K27ac signal at the same genomic regions as in C. e) Regulatory elements were binned into 20% quintiles based on accessibility change in MZpou5f3, MZsox19b and MZnanog mutants compared to wild-type embryos, and violin plots show the enrichment (ChIP/Input) of Eomesa, Mxtx2, Smad2 and FoxH1 binding at blastula stages [24,81,82]. *FoxH1 signal was normalized to the genome-wide mean as no input sample was available. p-values are shown for differences in TF binding strength between the different bins as assessed by one-sided Wilcoxon tests.

Acknowledgments
This image is the copyrighted work of the attributed author or publisher, and ZFIN has permission only to display this image to its users. Additional permissions should be obtained from the applicable author or publisher of the image. Full text @ PLoS Genet.