IMAGE

Fig 2

ID
ZDB-IMAGE-200220-30
Source
Figures for Pálfy et al., 2020
Image
Figure Caption

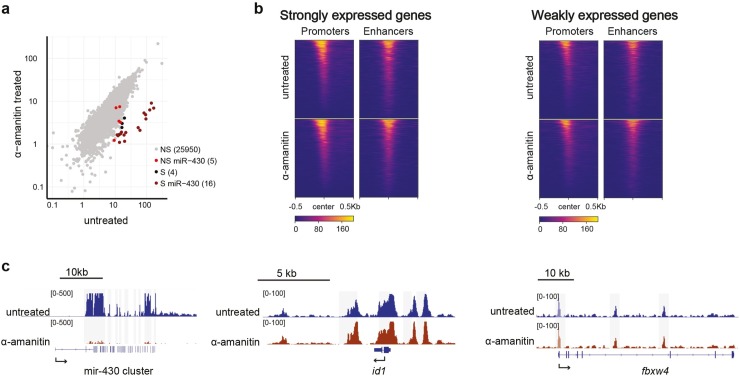
Fig 2 Transcription inhibition affects chromatin accessibility only at the miR-430 locus.

a) Correlation dot plot comparing accessibility in α-amanitin-treated embryos with untreated embryos. Significantly (S) and non-significantly (NS) affected peaks (DESeq2 log2 fold change -1.5, 5% FDR), as well as peaks that fall into the miR-430 cluster are indicated. b) Heatmaps of chromatin accessibility in untreated and α-amanitin-treated embryos, grouped based on the expression level of associated genes at sphere stage (expression data taken from [15]; strongly expressed genes are defined as the top 20% genes expressed at sphere stage (RPKM > = 0.419), whereas weakly expressed genes are all other genes (with a minimal expression of RPKM > = 0.004 at sphere stage). c) Genome browser snapshots of untreated and α-amanitin-treated embryos at oblong stage for the hypertranscribed miR-430 gene cluster; id1, a gene with strong zygotic expression; and fbxw4, a gene with weak zygotic expression.

Acknowledgments
This image is the copyrighted work of the attributed author or publisher, and ZFIN has permission only to display this image to its users. Additional permissions should be obtained from the applicable author or publisher of the image. Full text @ PLoS Genet.