IMAGE

Fig 3

ID
ZDB-IMAGE-200220-31
Source
Figures for Pálfy et al., 2020
Image
Figure Caption

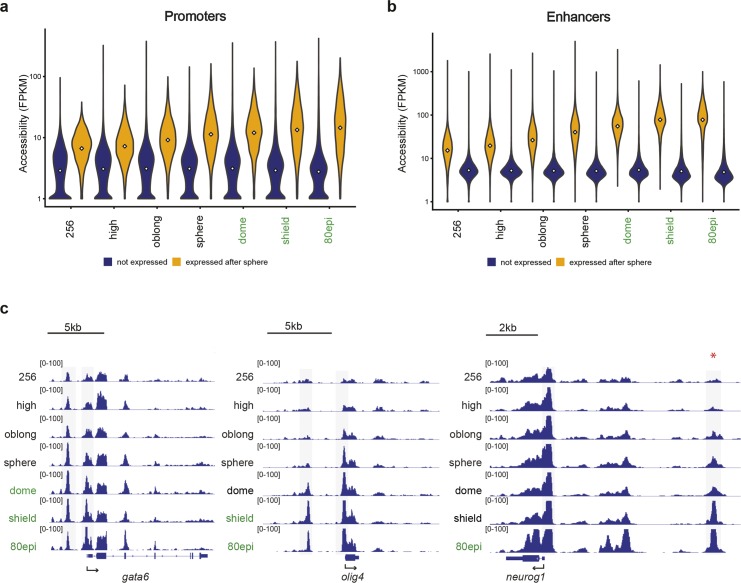
Fig 3 Chromatin accessibility at regulatory elements increases prior to gene activity.

a) Distribution of accessibility values (ATAC-seq FPKM) of promoters associated with genes that become activated after sphere stage (yellow), and genes that are not expressed (blue). White squares represent the median value. b) Distribution of accessibility values of enhancers associated with genes that become activated after sphere stage (yellow), and genes that are not expressed during early development (blue). White squares represent the median value. c) Genome browser snapshots of chromatin accessibility at the gata6, olig4 and neurog1 gene loci; stages at which genes are transcribed are indicated with green fonts, the red asterisk marks an experimentally validated neurog1 enhancer [37].

Acknowledgments
This image is the copyrighted work of the attributed author or publisher, and ZFIN has permission only to display this image to its users. Additional permissions should be obtained from the applicable author or publisher of the image. Full text @ PLoS Genet.