
IMAGE
Fig 1
- ID
- ZDB-IMAGE-200220-29
- Publication
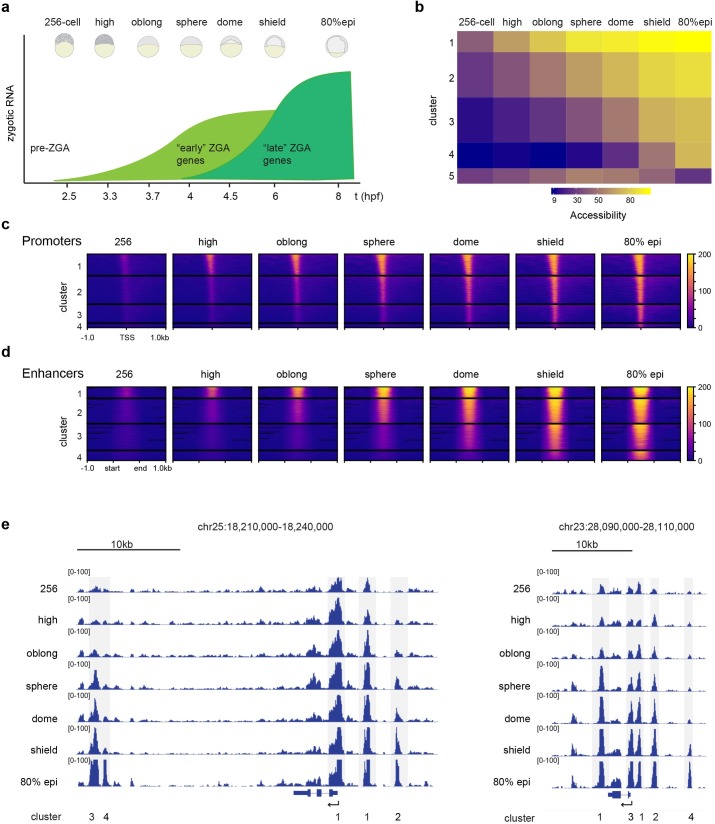
- Pálfy et al., 2020 - Chromatin accessibility established by Pou5f3, Sox19b and Nanog primes genes for activity during zebrafish genome activation
- All Figures
- Figures for Pálfy et al., 2020
Image
|
Figure Caption
Fig 1
Acknowledgments
This image is the copyrighted work of the attributed author or publisher, and
ZFIN has permission only to display this image to its users.
Additional permissions should be obtained from the applicable author or publisher of the image.
Full text @ PLoS Genet.