FIGURE SUMMARY
Title

Loss of UGP2 in brain leads to a severe epileptic encephalopathy, emphasizing that bi-allelic isoform-specific start-loss mutations of essential genes can cause genetic diseases

Authors
Perenthaler, E., Nikoncuk, A., Yousefi, S., Berdowski, W.M., Alsagob, M., Capo, I., van der Linde, H.C., van den Berg, P., Jacobs, E.H., Putar, D., Ghazvini, M., Aronica, E., van IJcken, W.F.J., de Valk, W.G., Medici-van den Herik, E., van Slegtenhorst, M., Brick, L., Kozenko, M., Kohler, J.N., Bernstein, J.A., Monaghan, K.G., Begtrup, A., Torene, R., Al Futaisi, A., Al Murshedi, F., Mani, R., Al Azri, F., Kamsteeg, E.J., Mojarrad, M., Eslahi, A., Khazaei, Z., Darmiyan, F.M., Doosti, M., Karimiani, E.G., Vandrovcova, J., Zafar, F., Rana, N., Kandaswamy, K.K., Hertecant, J., Bauer, P., AlMuhaizea, M.A., Salih, M.A., Aldosary, M., Almass, R., Al-Quait, L., Qubbaj, W., Coskun, S., Alahmadi, K.O., Hamad, M.H.A., Alwadaee, S., Awartani, K., Dababo, A.M., Almohanna, F., Colak, D., Dehghani, M., Mehrjardi, M.Y.V., Gunel, M., Ercan-Sencicek, A.G., Passi, G.R., Cheema, H.A., Efthymiou, S., Houlden, H., Bertoli-Avella, A.M., Brooks, A.S., Retterer, K., Maroofian, R., Kaya, N., van Ham, T.J., Barakat, T.S.
Source
Full text @ Acta Neuropathol.

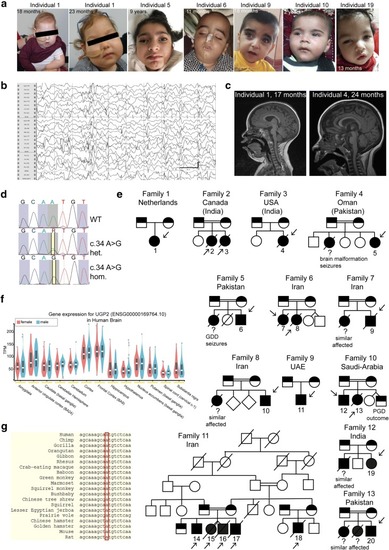
UGP2 homozygous variants in 20 individuals with severe epileptic encephalopathy. a Facial pictures of individual 1 (at 18 and 23 months), individual 5 (at 9 years), individual 6 (at 11 months), individual 9 (at 18 months), individual 10 (at 2 years) and individual 19 (at 13 months). Note the progressive microcephaly with sloping forehead, suture ridging, bitemporal narrowing, high hairline, arched eyebrows, pronounced philtrum, a relatively small mouth and large ears. b Electroencephalogram of individual 1 at the age of 8 months showing a highly disorganized pattern with high-voltage irregular slow waves intermixed with multifocal spikes and polyspikes. c T1-weighted mid-sagittal brain MRI of individual 1 (at 17 months) and individual 4 (at 24 months) illustrating global atrophy and microcephaly but no major structural anomalies. d Sanger sequencing traces of family 1, confirming the chr2:64083454A>G variant in UGP2 in heterozygous and homozygous states in parents and affected individual 1, respectively. e Family pedigrees of ascertained patients. Affected individuals and heterozygous parents are indicated in black and half black, respectively. Affected individuals with confirmed genotype are indicated with an arrow, and numbers. Other not-tested  affected siblings presenting with similar phenotypes are indicated with a question mark. Consanguineous parents are indicated with a double connection line. Males are squares, females are circles; unknown sex is indicated with rotated squares; deceased individuals are marked with a line. f Violin plots showing distribution of gene expression (in TPM) amongst male and female samples from the GTEx portal for various brain regions. Outliers are indicated by dots. g Multiple species sequence alignment from the UCSC browser, showing that the ATG start site is highly conserved

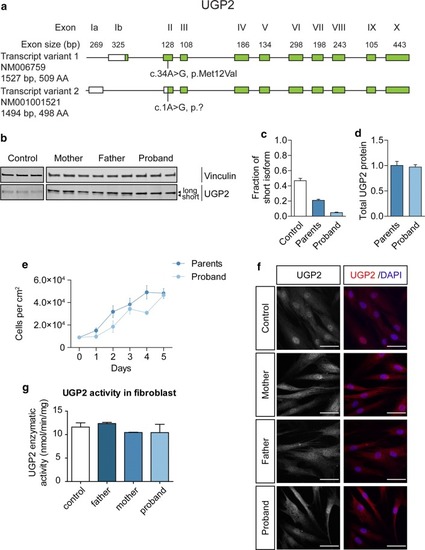
UGP2 homozygous variant leads to a loss of the shorter protein isoform in patient fibroblasts. a Schematic drawing of the human UGP2 locus, with both long and short transcript isoforms. Boxes represent exons, with coding sequences indicated in green. The location of the recurrent mutation is indicated in both transcripts. b Western blotting of cellular extracts derived from control fibroblasts and fibroblasts obtained from family 1, detecting the housekeeping control vinculin and UGP2. Note the two separated isoforms of UGP2 that have a similar intensity in wild-type cells. The shorter isoform is less expressed in fibroblasts from heterozygous parents and absent in fibroblasts from the affected proband. c Western blot quantification of the fraction of short UGP2 protein isoform compared to total UGP2 expression in control, parental heterozygous and proband homozygous fibroblasts, as determined in three independent experiments. Error bars represent SEM. d Western blot quantification of total UGP2 protein levels, as determined by the relative expression to the housekeeping control vinculin. Bar plot showing the results from three independent experiments. Error bars represent SEM; no significant differences were found between parents and proband, t test, two tailed. e Cell proliferation experiment of fibroblasts from heterozygous parents and homozygous proband from family 1, during a 5-day period, determined in three independent experiments. Error bars represent SEM. f Immunocytochemistry on cultured control and UGP2 heterozygous and homozygous mutant fibroblasts derived from family 1, detecting UGP2 (red). Nuclei are stained with DAPI. Scale bar 50 µm. g Enzymatic activity of UGP2 in control and UGP2 heterozygous and homozygous mutant fibroblasts derived from family 1. Shown is the mean of two independent experiments. Error bars represent SEM; no significant differences were found, unpaired t test, two tailed

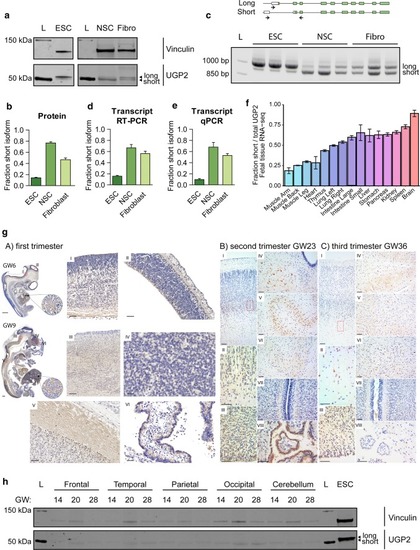
UGP2 short isoform is predominant in brain-related cell types. a Western blotting showing UGP2 expression in H9 human embryonic stem cells (ESCs), H9-derived neural stem cells (NSCs) and fibroblasts (Fibro). Vinculin is used as a housekeeping control. Note the changes in relative expression between the two UGP2 isoforms in the different cell types. L, ladder. b Western blot quantification of the fraction of short UGP2 protein isoform compared to total UGP2 expression, as determined in three independent experiments. Error bars represent SEM. c Multiplex RT-PCR of ESCs, NSCs and fibroblasts, showing a similar variability in isoform expression at the transcript and at the protein level. Each cell line was tested in triplicates. d Quantification of the fraction of the short UGP2 transcript isoform compared to total UGP2 expression, from the multiplex RT-PCR from c. Error bars represent SEM. e Quantification of the fraction of short UGP2 transcript isoform compared to total UGP2 expression by qRT-PCR in three independent experiments. Error bars represent SEM. f Ratio of RNA-seq reads covering the short transcript isoform compared to the total reads (covering both short and long isoforms), in multiple fetal tissues. In RNA-seq samples derived from brain, virtually all UGP2 expressions come from the short isoform. Error bars represent SD. g Immunohistochemistry detecting UGP2 in human fetal brains from the first, second and third trimester (gestational week (GW) 6, 9, 23 and 36). See text for details. h Western blotting detecting UGP2 in various human brain regions at weeks 14, 20 and 28 of gestation, showing the virtual absence of the long isoform expression in fetal brain. Vinculin is used as a housekeeping control. L ladder

RNA-seq of UGP2 mutant H9-derived neural stem cells. a Venn diagram showing the overlap between differentially expressed genes in UGP2 KO or KI NSCs that are upregulated (upper panel, genes with FDR < 0.05 and LogFC > 1) or downregulated (lower panel, genes with FDR < 0.05 and LogFC < -1) compared to wild-type NSCs. b Box plot showing the distribution of gene expression levels [in Log2(RPKM + 1)] from RNA-seq for the groups of genes displayed in a, in wild type, UGP2 KI or KO NSCs. Boxes are IQR; line is median; and whiskers extend to 1.5 × the IQR (*p < 0.05; **p < 0.01, ***p < 0.001, unpaired t test, two tailed). c Enrichment analysis using Enrichr [52] of up- or downregulated genes in NSCs from a for selected gene ontology sets, showing the five most enriched terms per set. Combined score and p value calculated by Enrichr are depicted (*p < 0.05; **p < 0.01; ***p < 0.001). d qRT-PCR validation of differentially expressed genes from RNA-seq in wild type, UGP2 KI, UGP2 KO NSCs and KO NSCs rescued with either WT or MUT (Met12Val) transcript isoform 1, at p5 of NSC differentiation. Bar plot showing the mean fold change for the indicated genes compared to wild type, normalized for the housekeeping gene TBP. Results of two biological and two independent technical replicates are plotted. Colors match the Venn diagram group to which the tested genes belong, from a. Error bars represent SEM; (*p < 0.05; **p < 0.01, ***p < 0.001, unpaired t test, one-tailed)

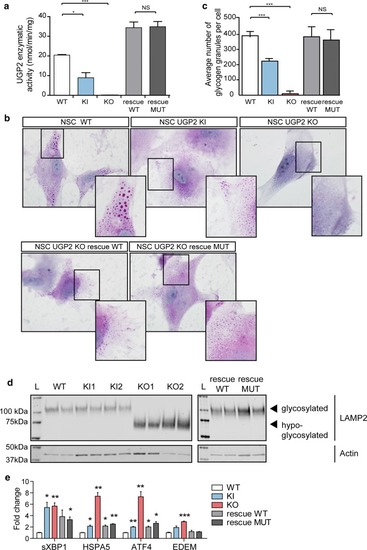
Metabolic changes upon UGP2 loss.
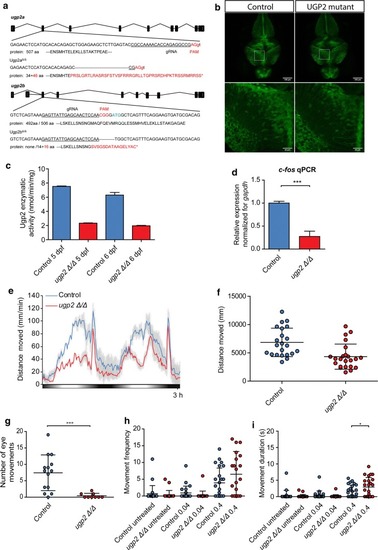
 a UGP2 enzymatic activity in WT, UGP2 KI, KO and KO NSCs rescued with WT or MUT (Met12Val) isoform 1 of UGP2. Bar plot showing the mean of two replicate experiments, error bar is SEM. *p < 0.05; ***p < 0.001, unpaired t test, two tailed. b Representative pictures of PAS staining in WT, KI, KO and rescued NSCs. Nuclei are counterstained with hematoxylin (blue). Inserts show zoom-in of part of the cytoplasm. Note the presence of glycogen granules in WT NSCs, their diminished number in KI NSCs, their absence in KO NSCs and their reappearance upon rescue with WT or MUT (Met12Val) isoform 1 of UGP2. c Quantification of the number of glycogen granules per cell in WT, UGP2 KI, KO and rescued NSCs, after 48 h culture under low-oxygen conditions. Shown is the average number of glycogen granules per cell, n = 80–100 cells per genotype. Error bars represent the SD. ***p < 0.001, unpaired t test, two tailed. d Western blotting detecting LAMP2 (upper panel) and the housekeeping control actin (lower panel) in cellular extracts from H9-derived NSCs that are WT, UGP2 KI, KO and KO cells rescued with WT or MUT (Met12Val) isoform 1 of UGP2. Glycosylated LAMP2 runs at ~ 110 kDa, whereas hypo-glycosylated LAMP2 is detected around 75 kDa. The absence of changes in LAMP2 glycosylation in KI cells is likely explained by a non-complete isoform switch upon in vitro NSC differentiation, resulting in residual UGP2 levels (see Supplementary Fig. 5d, online resource). e qRT-PCR expression analysis for UPR marker genes (spliced XBP1, HSPA5, ATF4 and EDEM) in WT, KI, KO and rescued NSCs. Shown is the mean fold change for the indicated genes compared to wild type, normalized for the housekeeping gene TBP. Results of two biological and two independent technical replicates are plotted, from two experiments. Error bars represent SEM; *p < 0.05; **p < 0.01, ***p < 0.001, unpaired t test, two tailed

Zebrafish disease modeling. a Schematic drawing of the ugp2a and ugp2b loci in zebrafish and the generated mutations. b Confocal images (maximum projection of confocal Z-stacks) of the brain of wild type (left) and ugp2aΔ/Δ; ugp2bΔ/Δ mutant zebrafish larvae (right), both in an slc1a2b-citrine reporter background, at 4 days post-fertilization (dpf). The lower panels are higher magnifications of the boxed regions indicated in the upper panels. Scale bar in upper panel is 100 µm, in lower panel 20 µm. In upper panel, Z = 45 with step size 4 µm; in lower panel, Z = 30 with step size 2 µm. c Enzymatic activity in ugp2 double mutant zebrafish larvae at 4 and 5 dpf, compared to wild-type age-matched controls, showing reduced Ugp2 enzyme activity in double mutant zebrafish. d qRT-PCR for the neuronal activity marker c-fos in wild type and ugp2 double mutant larvae at 3 dpf. For each group, 2 batches of 12 larvae were pooled. Shown is the mean fold change for the indicated genes compared to wild type, normalized for the housekeeping gene gapdh. Error bars represent SEM; ***p < 0.001, unpaired t test, two tailed. e Representative graph of a locomotion assay showing the total distance moved by larvae during the dusk–dawn routine (total time: 3 h 12 min), n = 24 larvae per genotype. Gray shading shows the standard error of the mean. f Quantification of the total distance moved throughout the experiment from e excluding the dark period. g Quantification of the number of observed spontaneous eye movements during a 2-min observation in wild type and ugp2 double mutant larvae at 4 dpf. Each dot represents one larva; shown is the average and SD; ***p < 0.001, t test, two tailed. h Quantification of the frequency of movements at a speed of > 15 mm/s, for wild-type control and ugp2 double mutant zebrafish larvae at 4 dpf, treated with mock control or with 0.04 nM or 0.4 nM 4-AP during a 35-min observation. Each dot represents a single larva; results of two experiments are shown, within total 24 larvae per condition. i Quantification of the movement duration at a speed of > 15 mm/s, for wild-type control and ugp2 double mutant zebrafish larvae at 4 dpf, treated with mock control or with 0.04 nM or 0.4 nM 4-AP during a 35-min observation. Each dot represents a single larva; results of two experiments are shown, with in total 24 larvae per condition. *p < 0.05, two-way ANOVA with Bonferoni post test

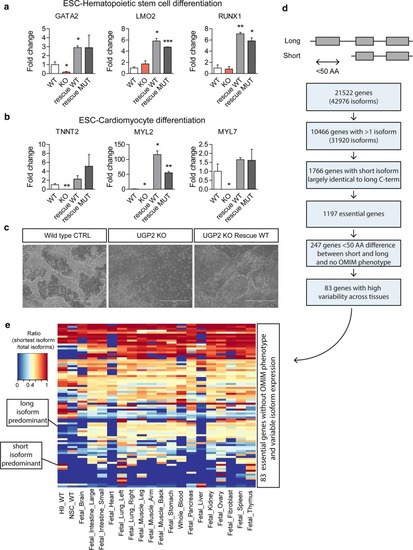
Essentiality of UGP2 and other disease candidate genes with a similar mutation mechanism. a qRT-PCR analysis of the hematopoietic stem cell markers GATA2, LMO2 and RUNX1, after 12 days of differentiation of wild type, UGP2 KO and UGP2 KO rescue ESCs. Shown is the mean fold change for the indicated genes compared to wild type, normalized for the housekeeping gene TBP. Results of two biological and two technical replicates are plotted. Error bars represent SEM; *p < 0.05; **p < 0.01, ***p < 0.001, unpaired t test, two tailed. b As a, but now for cardiomyocyte differentiation at day 15, assessing expression of the cardiomyocyte markers TNNT2, MYL2 and MYL7. c Bright-field image of cardiomyocyte cultures of wild type, UGP2 KO and rescue cells. Note the elongated organized monolayer structure cardiomyocytes capable of beating in wild type and rescue cells that are absent in KO cultures. Scale bar is 400 µm. d Scheme showing the homology search to identify genes with a similar structure as UGP2, where ATG-altering mutations could affect a tissue-specific isoform causing genetic disease. e Heat map showing the ratio of short isoform expression over total isoform expression from published RNA-seq data amongst 20 tissues for 83 out 247 essential genes that are not yet implicated in disease and in which the short and longer protein isoforms differ by less than 50 amino acids at the N-terminal

Acknowledgments
This image is the copyrighted work of the attributed author or publisher, and ZFIN has permission only to display this image to its users. Additional permissions should be obtained from the applicable author or publisher of the image. Full text @ Acta Neuropathol.