IMAGE

Fig. 4

ID
ZDB-IMAGE-200310-8
Source
Figures for Perenthaler et al., 2019
Image
Figure Caption

Fig. 4

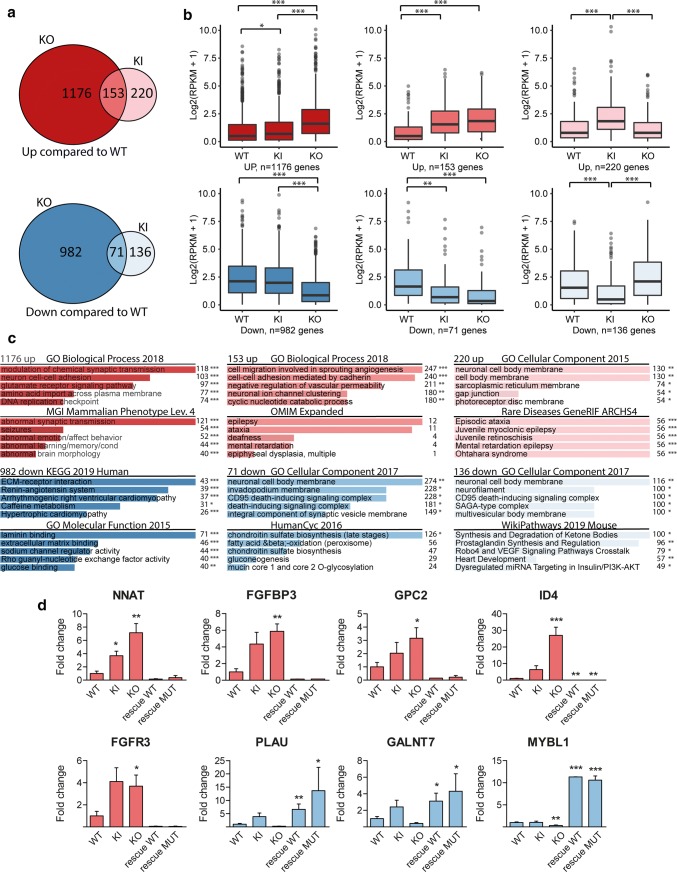
RNA-seq of UGP2 mutant H9-derived neural stem cells. a Venn diagram showing the overlap between differentially expressed genes in UGP2 KO or KI NSCs that are upregulated (upper panel, genes with FDR < 0.05 and LogFC > 1) or downregulated (lower panel, genes with FDR < 0.05 and LogFC < -1) compared to wild-type NSCs. b Box plot showing the distribution of gene expression levels [in Log2(RPKM + 1)] from RNA-seq for the groups of genes displayed in a, in wild type, UGP2 KI or KO NSCs. Boxes are IQR; line is median; and whiskers extend to 1.5 × the IQR (*p < 0.05; **p < 0.01, ***p < 0.001, unpaired t test, two tailed). c Enrichment analysis using Enrichr [52] of up- or downregulated genes in NSCs from a for selected gene ontology sets, showing the five most enriched terms per set. Combined score and p value calculated by Enrichr are depicted (*p < 0.05; **p < 0.01; ***p < 0.001). d qRT-PCR validation of differentially expressed genes from RNA-seq in wild type, UGP2 KI, UGP2 KO NSCs and KO NSCs rescued with either WT or MUT (Met12Val) transcript isoform 1, at p5 of NSC differentiation. Bar plot showing the mean fold change for the indicated genes compared to wild type, normalized for the housekeeping gene TBP. Results of two biological and two independent technical replicates are plotted. Colors match the Venn diagram group to which the tested genes belong, from a. Error bars represent SEM; (*p < 0.05; **p < 0.01, ***p < 0.001, unpaired t test, one-tailed)

Acknowledgments
This image is the copyrighted work of the attributed author or publisher, and ZFIN has permission only to display this image to its users. Additional permissions should be obtained from the applicable author or publisher of the image. Full text @ Acta Neuropathol.