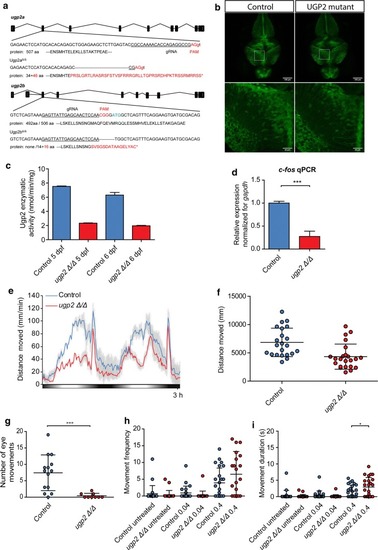
Zebrafish disease modeling. a Schematic drawing of the ugp2a and ugp2b loci in zebrafish and the generated mutations. b Confocal images (maximum projection of confocal Z-stacks) of the brain of wild type (left) and ugp2aΔ/Δ; ugp2bΔ/Δ mutant zebrafish larvae (right), both in an slc1a2b-citrine reporter background, at 4 days post-fertilization (dpf). The lower panels are higher magnifications of the boxed regions indicated in the upper panels. Scale bar in upper panel is 100 µm, in lower panel 20 µm. In upper panel, Z = 45 with step size 4 µm; in lower panel, Z = 30 with step size 2 µm. c Enzymatic activity in ugp2 double mutant zebrafish larvae at 4 and 5 dpf, compared to wild-type age-matched controls, showing reduced Ugp2 enzyme activity in double mutant zebrafish. d qRT-PCR for the neuronal activity marker c-fos in wild type and ugp2 double mutant larvae at 3 dpf. For each group, 2 batches of 12 larvae were pooled. Shown is the mean fold change for the indicated genes compared to wild type, normalized for the housekeeping gene gapdh. Error bars represent SEM; ***p < 0.001, unpaired t test, two tailed. e Representative graph of a locomotion assay showing the total distance moved by larvae during the dusk–dawn routine (total time: 3 h 12 min), n = 24 larvae per genotype. Gray shading shows the standard error of the mean. f Quantification of the total distance moved throughout the experiment from e excluding the dark period. g Quantification of the number of observed spontaneous eye movements during a 2-min observation in wild type and ugp2 double mutant larvae at 4 dpf. Each dot represents one larva; shown is the average and SD; ***p < 0.001, t test, two tailed. h Quantification of the frequency of movements at a speed of > 15 mm/s, for wild-type control and ugp2 double mutant zebrafish larvae at 4 dpf, treated with mock control or with 0.04 nM or 0.4 nM 4-AP during a 35-min observation. Each dot represents a single larva; results of two experiments are shown, within total 24 larvae per condition. i Quantification of the movement duration at a speed of > 15 mm/s, for wild-type control and ugp2 double mutant zebrafish larvae at 4 dpf, treated with mock control or with 0.04 nM or 0.4 nM 4-AP during a 35-min observation. Each dot represents a single larva; results of two experiments are shown, with in total 24 larvae per condition. *p < 0.05, two-way ANOVA with Bonferoni post test
|
