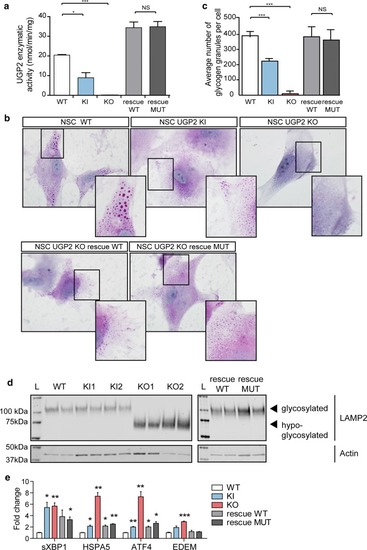
Metabolic changes upon UGP2 loss. a UGP2 enzymatic activity in WT, UGP2 KI, KO and KO NSCs rescued with WT or MUT (Met12Val) isoform 1 of UGP2. Bar plot showing the mean of two replicate experiments, error bar is SEM. *p < 0.05; ***p < 0.001, unpaired t test, two tailed. b Representative pictures of PAS staining in WT, KI, KO and rescued NSCs. Nuclei are counterstained with hematoxylin (blue). Inserts show zoom-in of part of the cytoplasm. Note the presence of glycogen granules in WT NSCs, their diminished number in KI NSCs, their absence in KO NSCs and their reappearance upon rescue with WT or MUT (Met12Val) isoform 1 of UGP2. c Quantification of the number of glycogen granules per cell in WT, UGP2 KI, KO and rescued NSCs, after 48 h culture under low-oxygen conditions. Shown is the average number of glycogen granules per cell, n = 80–100 cells per genotype. Error bars represent the SD. ***p < 0.001, unpaired t test, two tailed. d Western blotting detecting LAMP2 (upper panel) and the housekeeping control actin (lower panel) in cellular extracts from H9-derived NSCs that are WT, UGP2 KI, KO and KO cells rescued with WT or MUT (Met12Val) isoform 1 of UGP2. Glycosylated LAMP2 runs at ~ 110 kDa, whereas hypo-glycosylated LAMP2 is detected around 75 kDa. The absence of changes in LAMP2 glycosylation in KI cells is likely explained by a non-complete isoform switch upon in vitro NSC differentiation, resulting in residual UGP2 levels (see Supplementary Fig. 5d, online resource). e qRT-PCR expression analysis for UPR marker genes (spliced XBP1, HSPA5, ATF4 and EDEM) in WT, KI, KO and rescued NSCs. Shown is the mean fold change for the indicated genes compared to wild type, normalized for the housekeeping gene TBP. Results of two biological and two independent technical replicates are plotted, from two experiments. Error bars represent SEM; *p < 0.05; **p < 0.01, ***p < 0.001, unpaired t test, two tailed
|
