
- Title
-
Adaptive prospective optical gating enables day-long 3D time-lapse imaging of the beating embryonic zebrafish heart
- Authors
- Taylor, J.M., Nelson, C.J., Bruton, F.A., Baghbadrani, A.K., Buckley, C., Tucker, C.S., Rossi, A.G., Mullins, J.J., Denvir, M.A.
- Source
- Full text @ Nat. Commun.
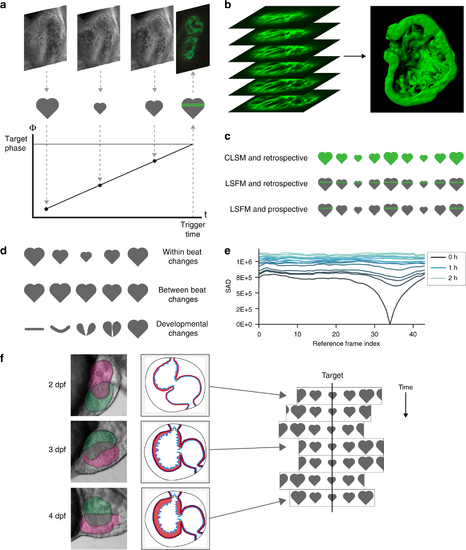
Developmental changes in cardiac morphology prevent day-long time-lapse imaging with existing algorithms. a In prospective optical gating, brightfield images (greyscale) are acquired and analysed in real time to assign a phase (temporal position in the cardiac cycle) to each frame. Forward prediction is then used to accurately trigger acquisition of one synchronised fluorescence image (green) at a user-defined target phase. b The sample is scanned through the light sheet to generate a synchronised 3D z-stack. c The move from confocal laser scanning microscopy (CLSM; upper) to light sheet fluorescence microscopy (LSFM; middle) reduces phototoxic effects by several orders of magnitude by limiting excitation in space. Similarly, the move from retrospective (upper and middle) to prospective gating (lower) reduces phototoxic effects yet further by limiting excitation in time. d Prospective optical gating relies on periodic changes within heartbeats (upper) and is able to cope with small changes between heartbeats (middle). However, phase-lock cannot be maintained over developmental time scales, because the heart undergoes drastic morphological changes (lower). e These changes mean that image-based similarity metrics are unable to match new brightfield images against the reference heartbeat image sequence recorded at the start of the experiment. f A new “smart microscope” is required that can maintain phase-lock in the face of these drastic changes in cardiac morphology over the course of day-long time-lapse imaging |
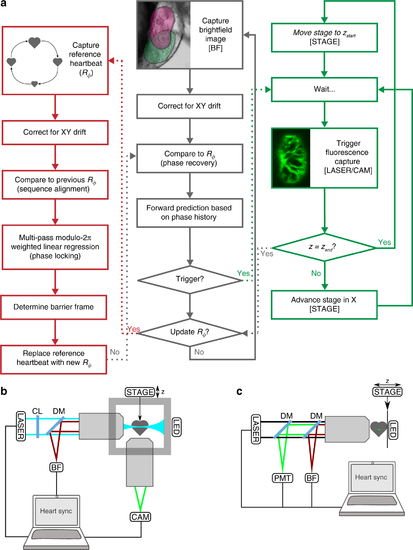
Adaptive prospective optical gating permits day-long, phase-locked cardiac imaging. a Summary flow chart for adaptive prospective optical gating. Each column represents a separate thread running concurrently on the computer. The core prospective optical gating algorithm (centre, grey) identifies the current cardiac phase using the brightfield channel, and computes the correct future trigger time. The day-long phase locking algorithm (left, red) enables the system to cope with developmental-scale changes in cardiac morphology and size. The optical gating algorithms are integrated with fluorescence 𝑧-stack acquisition and stage movement (right, green). Square brackets refer to hardware components in the schematic diagrams below. b, c Simplified schematics of the custom light sheet microscope (b) and commercial two-photon microscope (c) used in this paper, highlighting the key components for adaptive prospective optical gating. Fluorescence (excited by LASER) is imaged onto a triggerable scientific camera (CAM) or photomultiplier (PMT). An infrared light source (LED) provides illumination for a brightfield camera (BF); in b this receives light collected through the laser launch objective, for reasons explained in the main text. A full optical diagram for b can be found in Supplementary Fig. 1. Other components: STAGE motorised z-stage; CL cylindrical lens; DM dichroic mirror to separate different light wavelengths |
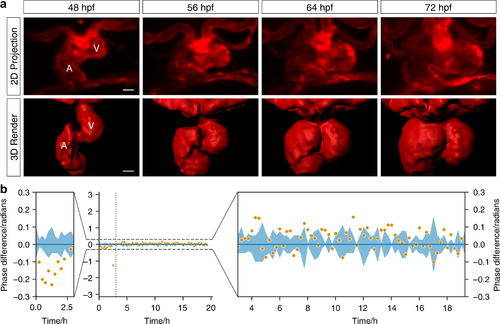
Phase-locked, day-long cardiac time-lapse imaging of cardiac morphogenesis. a The process of cardiac looping, previously observed by histological studies at significantly lower temporal resolution, is now seen in direct 3D video detail (48–72 hpf, at 300 s intervals). The endothelium lining blood vessels and heart chambers is seen during completion of cardiac looping (red—transgene flk1:mCherry). Selected timepoints shown as maximum intensity projections (MIPs) of 𝑧-stacks and 3D render (from Supplementary Videos 4 and 5). V ventricle; A atrium. b Adaptive prospective optical gating algorithm (orange) phase-lock performance is compared against human judgements of best-matching frames (blue; line represents mean and shaded area represents the standard deviation). Viewing over the full 2𝜋 range (middle) confirms the high precision and accuracy of the gating. Zoomed details (left and right) reveal a minor residual drift in phase during the early time period in which the heart underwent the most dramatic changes in shape and position, but otherwise very high stability |
Sustained beating-heart time-lapse imaging of immune cell responses to cardiac injury. |
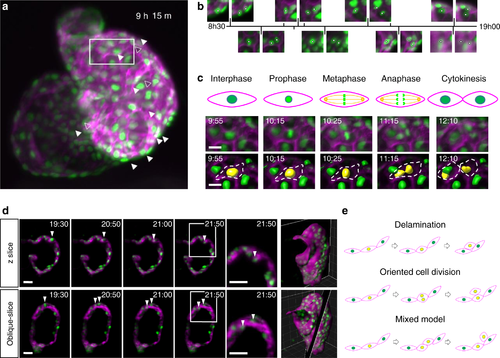
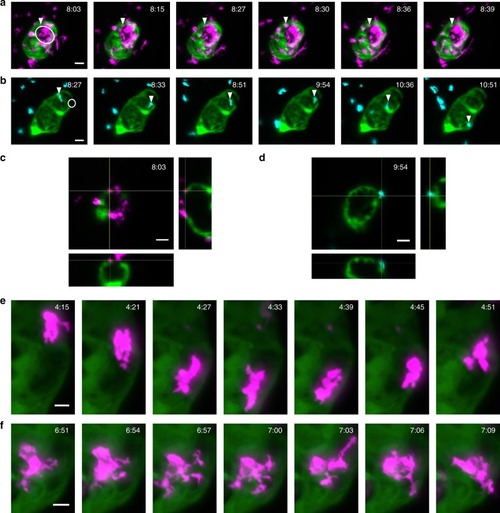
Mapping cardiomyocyte migration and cell division during myocardial trabeculation. a Representative MIP from a 24 h time-lapse of a 72–96 hpf zebrafish (Supplementary Video 10). Image shows cardiomyocyte nuclei (green—transgene myl7:h2b-gfp) and cardiomyocyte cell membranes (magenta—transgene myl7:mKate-CAAX), with strongest signal expressed in the ventricle. Nuclei of cardiomyocytes which will later divide are indicated by white arrowheads (open-arrowheads for less-obvious divisions near the posterior wall of the heart). Region-of interest for c is indicated with white box. b Detail from time-lapse: pairs of images plotted on a timeline, illustrating selected cardiomyocytes shortly before (left) and after (right) cell division; nuclei indicated with white circles. c A selected cardiomyocyte division clearly exhibits key stages of mitosis. Mitotic stages (schematic: top row) are visible at selected timepoints from the time-lapse sequence (MIPs: middle row), and the nuclear volume changes and karyokinesis typical of cell division can be seen (dividing nucleus surface-rendered in yellow: bottom row). d A dividing cardiomyocyte nucleus is shown in the acquisition plane (z-slice, top row) and in the plane of division (oblique slice, bottom row) across two and a half hours of imaging with 5 min time-lapse resolution. White arrowheads highlight the observation of two daughter cardiomyocyte nuclei in the oblique-slice, which would have been missed in the z-slice or 2D imaging. The final time point is shown zoomed-in to highlight the migration of the two daughter cells across the time period. Whole rendered heart ventricle (magenta) with rendered nuclei (green) indicate the z-slice and oblique-slice views used. e Schematic illustrating three models of cardiac trabecular initiation: delamination model (top), cell division model (middle) and mixed model (bottom). Delaminating cardiomyocytes are indicated by a yellow nucleus. Scale bars: 30 μm (10 μm for c) |