
Fig. 6
- ID
- ZDB-FIG-200601-17
- Publication
- Taylor et al., 2019 - Adaptive prospective optical gating enables day-long 3D time-lapse imaging of the beating embryonic zebrafish heart
- Other Figures
- All Figure Page
- Back to All Figure Page
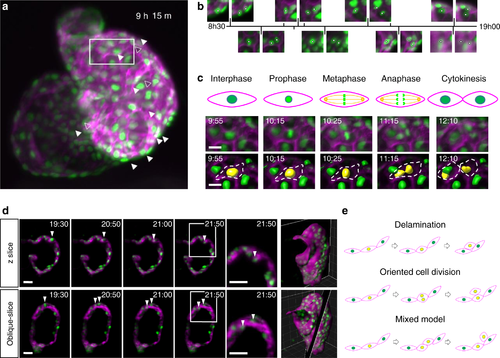
Mapping cardiomyocyte migration and cell division during myocardial trabeculation. a Representative MIP from a 24 h time-lapse of a 72–96 hpf zebrafish (Supplementary Video 10). Image shows cardiomyocyte nuclei (green—transgene myl7:h2b-gfp) and cardiomyocyte cell membranes (magenta—transgene myl7:mKate-CAAX), with strongest signal expressed in the ventricle. Nuclei of cardiomyocytes which will later divide are indicated by white arrowheads (open-arrowheads for less-obvious divisions near the posterior wall of the heart). Region-of interest for c is indicated with white box. b Detail from time-lapse: pairs of images plotted on a timeline, illustrating selected cardiomyocytes shortly before (left) and after (right) cell division; nuclei indicated with white circles. c A selected cardiomyocyte division clearly exhibits key stages of mitosis. Mitotic stages (schematic: top row) are visible at selected timepoints from the time-lapse sequence (MIPs: middle row), and the nuclear volume changes and karyokinesis typical of cell division can be seen (dividing nucleus surface-rendered in yellow: bottom row). d A dividing cardiomyocyte nucleus is shown in the acquisition plane (z-slice, top row) and in the plane of division (oblique slice, bottom row) across two and a half hours of imaging with 5 min time-lapse resolution. White arrowheads highlight the observation of two daughter cardiomyocyte nuclei in the oblique-slice, which would have been missed in the z-slice or 2D imaging. The final time point is shown zoomed-in to highlight the migration of the two daughter cells across the time period. Whole rendered heart ventricle (magenta) with rendered nuclei (green) indicate the z-slice and oblique-slice views used. e Schematic illustrating three models of cardiac trabecular initiation: delamination model (top), cell division model (middle) and mixed model (bottom). Delaminating cardiomyocytes are indicated by a yellow nucleus. Scale bars: 30 μm (10 μm for c) |