
Fig. 3
- ID
- ZDB-IMAGE-200601-18
- Publication
- Taylor et al., 2019 - Adaptive prospective optical gating enables day-long 3D time-lapse imaging of the beating embryonic zebrafish heart
- All Figures
- Figures for Taylor et al., 2019
|
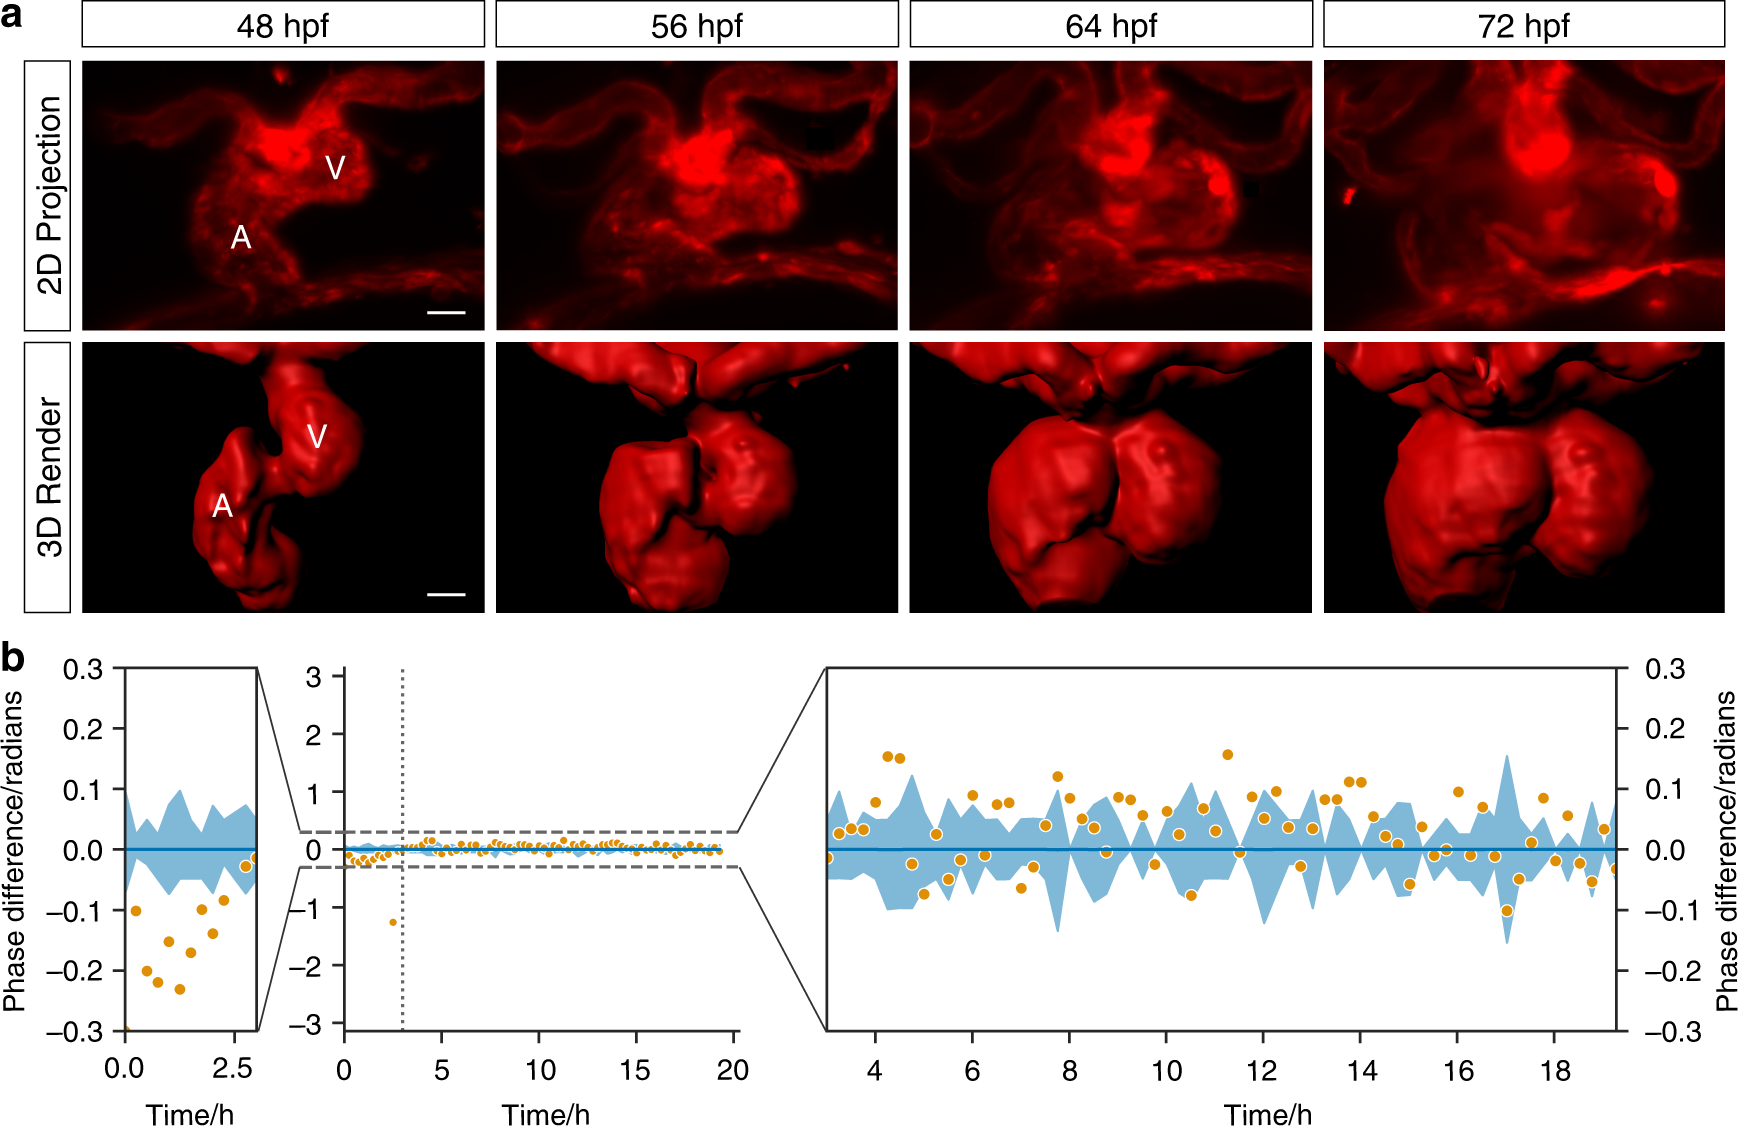
Fig. 3 Phase-locked, day-long cardiac time-lapse imaging of cardiac morphogenesis. a The process of cardiac looping, previously observed by histological studies at significantly lower temporal resolution, is now seen in direct 3D video detail (48–72 hpf, at 300 s intervals). The endothelium lining blood vessels and heart chambers is seen during completion of cardiac looping (red—transgene flk1:mCherry). Selected timepoints shown as maximum intensity projections (MIPs) of 𝑧-stacks and 3D render (from Supplementary Videos 4 and 5). V ventricle; A atrium. b Adaptive prospective optical gating algorithm (orange) phase-lock performance is compared against human judgements of best-matching frames (blue; line represents mean and shaded area represents the standard deviation). Viewing over the full 2𝜋 range (middle) confirms the high precision and accuracy of the gating. Zoomed details (left and right) reveal a minor residual drift in phase during the early time period in which the heart underwent the most dramatic changes in shape and position, but otherwise very high stability