
- Title
-
Sublethal antibiotics collapse gut bacterial populations by enhancing aggregation and expulsion
- Authors
- Schlomann, B.H., Wiles, T.J., Wall, E.S., Guillemin, K., Parthasarathy, R.
- Source
- Full text @ Proc. Natl. Acad. Sci. USA
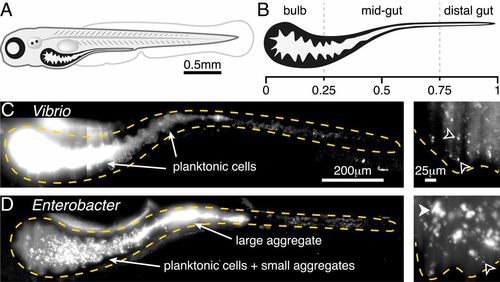
Two bacterial species show different extremes of in vivo aggregation phenotypes. (A) Schematic of a zebrafish 5 dpf. (B) Schematic of the larval zebrafish intestine with numbers denoting approximate fraction of gut length. (C) V. cholerae ZWU0020 in vivo. (Left) A maximum-intensity projection of a 3D image of the full gut. Dense, bright bacteria and dimmer intestinal autofluorescence are evident. The orange dashed curve indicates a coarse outline of the gut boundary. (Scale bar: 200 μm.) (Right) A single optical plane within the anterior bulb in a fish colonized with 1:100 green fluorescent protein (GFP):dTomato (dTom)-expressing Vibrio, with the GFP channel shown to highlight individual microbes in the dense swarm. The orange dashed curve indicates the approximate contour of the intestinal epithelium. Black arrowheads indicate examples of single planktonic cells ( Movie S1). (Scale bar: 25 μm.) (D) E. cloacae ZOR0014 in vivo, shown as a maximum-intensity projection of the full gut (Left) and a subset of the same projection in the anterior bulb (Right). Bacterial aggregates are evident. The black arrowhead indicates an example of a single planktonic cell; the white arrowhead indicates an example of a multicellular aggregate. (Scale bars, same as in C.) |
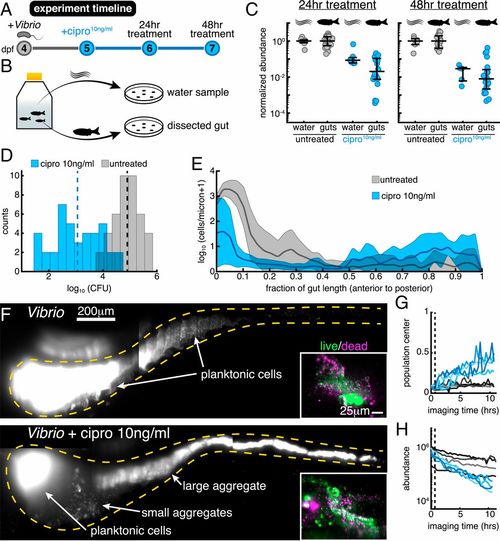
Low-dose ciprofloxacin induces Vibrio aggregation and expulsion in vivo. (A) Schematic of the experimental timeline. (B) Schematic of the sampling scheme for plating measurements. (C) Normalized abundances (number of CFUs scaled by untreated medians) of water and gut populations. N values left to right: 8, 24, 7, 20, 6, 18, 5, 20. Water N values denote number of flasks; gut N values denote number of fish. (D) Histograms of gut CFUs with pooled data from 24- to 48-h treatments. Counts indicate the number of individual fish with a given log10 Vibrio CFUs. Dashed lines indicate the mean of each set, showing an ∼100-fold reduction in intestinal Vibrio abundance in antibiotic-treated fish. (E) Ensemble-averaged spatial distributions of log-transformed cell density as a function of distance along the gut axis, integrated over the perpendicular dimensions. (F) Maximum-intensity projections of 3D images of untreated (Top) and ciprofloxacin-treated (Bottom) Vibrio populations. Insets show viability staining of bacteria expelled from the gut, with green and magenta indicating living and dead cells, respectively. (Gand H) Dynamics of in vivo Vibrio populations untreated (gray lines) and treated with 10 ng/mL ciprofloxacin (blue lines). (G) The 1D center of mass, normalized to intestine length. (H) Total image-derived Vibrio abundance. In both G and H, each curve represents a different zebrafish. Vertical dotted lines indicate the time of drug administration to the treatment cohort, t=0.67 h. |

Low-dose ciprofloxacin collapses Enterobacter populations and suppresses small clusters in vivo. (A) Normalized abundances (number of CFUs scaled by untreated medians) of water and gut populations. N values left to right: 4, 20, 4, 20, 4, 19, 4, 20. Water N values denote number of flasks; gut N values denote number of fish. (B) Histograms of gut CFUs with pooled data from 24- to 48-h treatments. Counts indicate the number of individual fish with a given log10 Enterobacter CFUs. Dashed lines indicate the mean of each set, showing an ∼1,000-fold reduction in intestinal Enterobacter abundance in antibiotic-treated fish. (C) Total number of bacterial clusters in the intestine, quantified from 3D images (Materials and Methods). (D) Maximum-intensity projections of 3D images of untreated (Top) and ciprofloxacin-treated (Bottom) Enterobacter populations. Insets show viability staining of bacteria expelled from the gut, with green and magenta indicating living and dead cells, respectively. |

Small bacterial clusters are required for recovery after large expulsion events. (A) Maximum-intensity projections of untreated Enterobacter populations before (Top, t=2 h from the start of imaging) and after (Bottom, t=3 h) an expulsion event (Movie S5). (Scale bar, 200 μm.) (B) Schematic of a kinetic model of bacterial cluster dynamics, illustrating its 4 constituent processes. (C) Image-derived time series of Enterobacter abundance in 5 untreated hosts showing sporadic large expulsion events. |