
Fig. 1
- ID
- ZDB-FIG-191028-9
- Publication
- Schlomann et al., 2019 - Sublethal antibiotics collapse gut bacterial populations by enhancing aggregation and expulsion
- Other Figures
- All Figure Page
- Back to All Figure Page
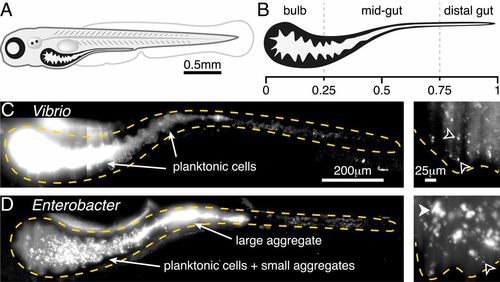
Two bacterial species show different extremes of in vivo aggregation phenotypes. (A) Schematic of a zebrafish 5 dpf. (B) Schematic of the larval zebrafish intestine with numbers denoting approximate fraction of gut length. (C) V. cholerae ZWU0020 in vivo. (Left) A maximum-intensity projection of a 3D image of the full gut. Dense, bright bacteria and dimmer intestinal autofluorescence are evident. The orange dashed curve indicates a coarse outline of the gut boundary. (Scale bar: 200 μm.) (Right) A single optical plane within the anterior bulb in a fish colonized with 1:100 green fluorescent protein (GFP):dTomato (dTom)-expressing Vibrio, with the GFP channel shown to highlight individual microbes in the dense swarm. The orange dashed curve indicates the approximate contour of the intestinal epithelium. Black arrowheads indicate examples of single planktonic cells ( Movie S1). (Scale bar: 25 μm.) (D) E. cloacae ZOR0014 in vivo, shown as a maximum-intensity projection of the full gut (Left) and a subset of the same projection in the anterior bulb (Right). Bacterial aggregates are evident. The black arrowhead indicates an example of a single planktonic cell; the white arrowhead indicates an example of a multicellular aggregate. (Scale bars, same as in C.) |