
|
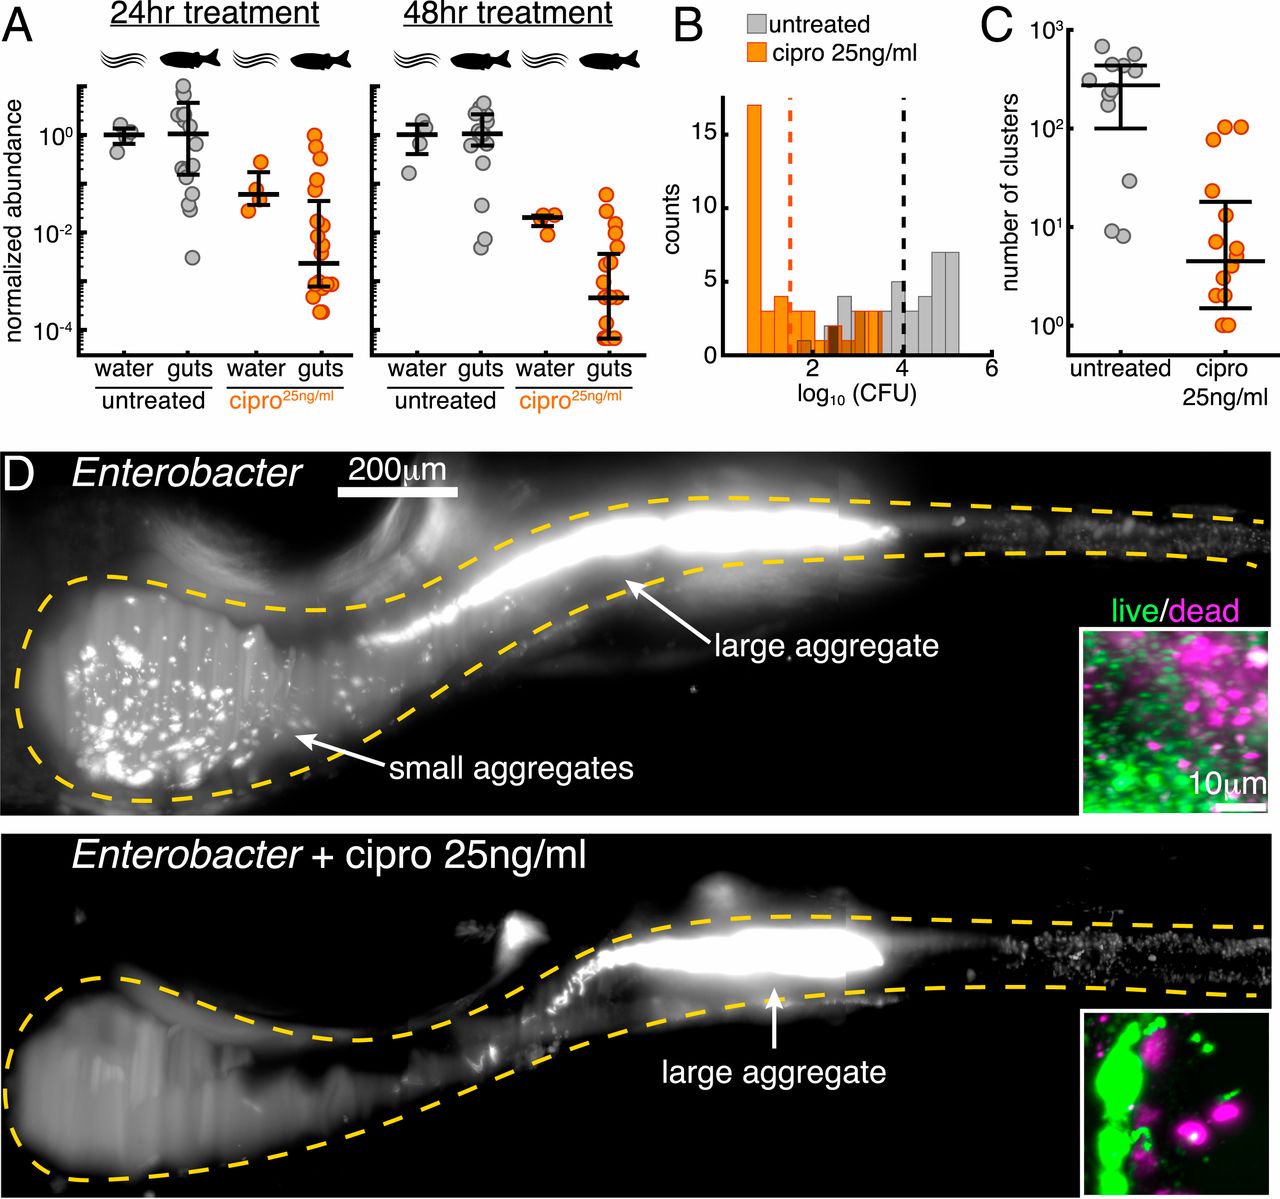
Fig. 3
Low-dose ciprofloxacin collapses Enterobacter populations and suppresses small clusters in vivo. (A) Normalized abundances (number of CFUs scaled by untreated medians) of water and gut populations. N values left to right: 4, 20, 4, 20, 4, 19, 4, 20. Water N values denote number of flasks; gut N values denote number of fish. (B) Histograms of gut CFUs with pooled data from 24- to 48-h treatments. Counts indicate the number of individual fish with a given log10 Enterobacter CFUs. Dashed lines indicate the mean of each set, showing an ∼1,000-fold reduction in intestinal Enterobacter abundance in antibiotic-treated fish. (C) Total number of bacterial clusters in the intestine, quantified from 3D images (Materials and Methods). (D) Maximum-intensity projections of 3D images of untreated (Top) and ciprofloxacin-treated (Bottom) Enterobacter populations. Insets show viability staining of bacteria expelled from the gut, with green and magenta indicating living and dead cells, respectively.