
|
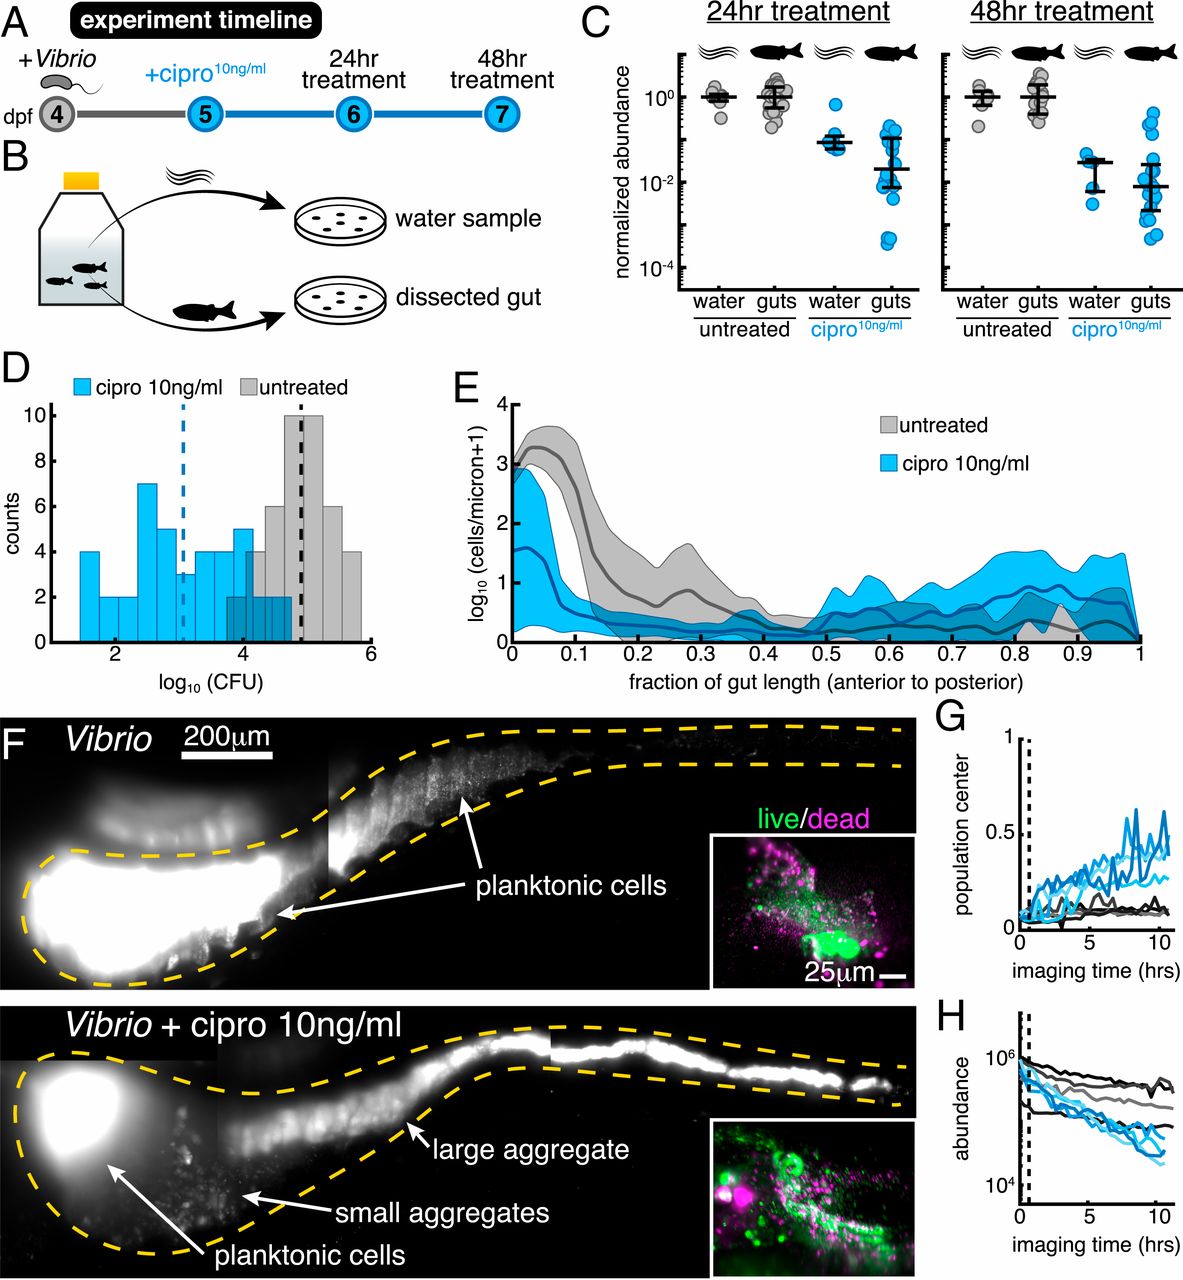
Fig. 2
Low-dose ciprofloxacin induces Vibrio aggregation and expulsion in vivo. (A) Schematic of the experimental timeline. (B) Schematic of the sampling scheme for plating measurements. (C) Normalized abundances (number of CFUs scaled by untreated medians) of water and gut populations. N values left to right: 8, 24, 7, 20, 6, 18, 5, 20. Water N values denote number of flasks; gut N values denote number of fish. (D) Histograms of gut CFUs with pooled data from 24- to 48-h treatments. Counts indicate the number of individual fish with a given log10 Vibrio CFUs. Dashed lines indicate the mean of each set, showing an ∼100-fold reduction in intestinal Vibrio abundance in antibiotic-treated fish. (E) Ensemble-averaged spatial distributions of log-transformed cell density as a function of distance along the gut axis, integrated over the perpendicular dimensions. (F) Maximum-intensity projections of 3D images of untreated (Top) and ciprofloxacin-treated (Bottom) Vibrio populations. Insets show viability staining of bacteria expelled from the gut, with green and magenta indicating living and dead cells, respectively. (Gand H) Dynamics of in vivo Vibrio populations untreated (gray lines) and treated with 10 ng/mL ciprofloxacin (blue lines). (G) The 1D center of mass, normalized to intestine length. (H) Total image-derived Vibrio abundance. In both G and H, each curve represents a different zebrafish. Vertical dotted lines indicate the time of drug administration to the treatment cohort, t=0.67 h.