
- Title
-
Establishment of an adult zebrafish model of retinal neurodegeneration induced by NMDA
- Authors
- Luo, Z.W., Wang, H.T., Wang, N., Sheng, W.W., Jin, M., Lu, Y., Bai, Y.J., Zou, S.Q., Pang, Y.L., Xu, H., Zhang, X.
- Source
- Full text @ Int J Ophthalmol
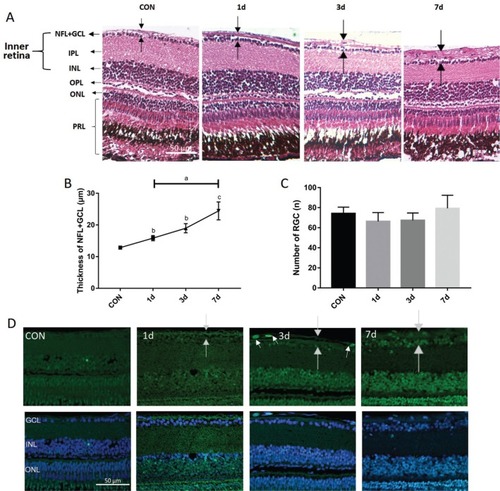
Histology of NMDA-induced thicker NFL (time gradient) A-D: The zebrafish were treated by I.M. in NMDA and divided into 4 distinct groups with different treatment times. A: H&E staining shows representative paraffin sections (4 µm) from a wild-type control retina immersed in distilled water along with retinas treated with 100 µmol/L NMDA for 1, 3, and 7d. The dark arrow points out the thickness of each layer. B: The thickness of the NFL+GCL (y-axis) plotted against the NMDA treatment time; C: The number of GCL (y-axis) plotted against the NMDA treatment time. Error bars represent standard error of the mean (±SEM); n=6. (unpaired t-test, aP<0.05, bP<0.01, and cP<0.001 compared with control); D: TUNEL staining of NMDA treatment time points and control retinas. White arrows point to apoptotic cells. NFL: Nerve fiber layer; GCL: Ganglion cell layer; IPL: Inner plexiform layer; INL: Inner nuclear layer; OPL: Outer plexiform layer; ONL: Outer nuclear layer; PRL: Photoreceptor layer. Magnification is 40×. Scale bar, 50 µm. |
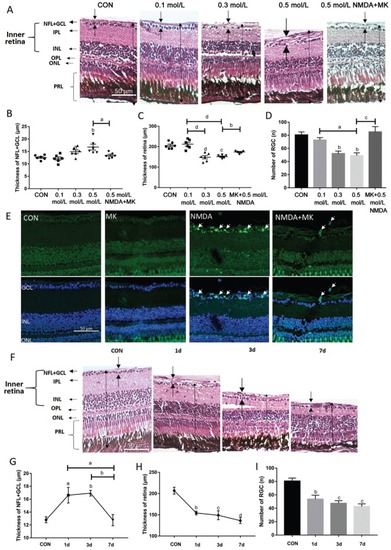
NMDA-induced alterations in retinal histology, thickness and retinal ganglion cell apoptosis A-D: The zebrafish were treated by I.V. of NMDA at different doses for 1d. A: H&E staining of paraffin sections (4 µm) from a control retina treated with 100 nL PBS and retinas treated with 0.1, 0.3, 0.5 mol/L NMDA, and 0.05 mol/L MK-801+0.5 mol/L NMDA. The dark arrows show the thickness of each layer. B: The thickness of the NFL+GCL from different treatment groups; C: The thickness of retinas from different treatment groups; D: The retinal ganglion cell number of retinas from different treatment groups. Error bars represent standard error of the mean (±SEM); n=6 (unpaired t-test, aP<0.05, bP<0.01, cP<0.001, and dP<0.0001 compared with control); E: TUNEL staining of representative control retinas and retinas treated with 50 mmol/L MK-801, 0.5 mol/L NMDA, and MK-801+NMDA. The white arrows point to apoptosis cells. F: H&E staining of paraffin sections (4 µm) from retinas treated intravitreally with 1× PBS (control) or with 0.5 mol/L NMDA for various times; G: The thickness of the NFL+GCL from different treatment groups; H: The thickness of retinas from different treatment groups; I: The retinal ganglion cell number from retinas of different treatment groups. Error bars represent standard error of the mean (±SEM); n=6 (unpaired t-test, aP<0.05, bP<0.01, cP<0.001, and dP<0.0001 compared with control). Original magnification is 40×. Scale bar, 50 µm. |
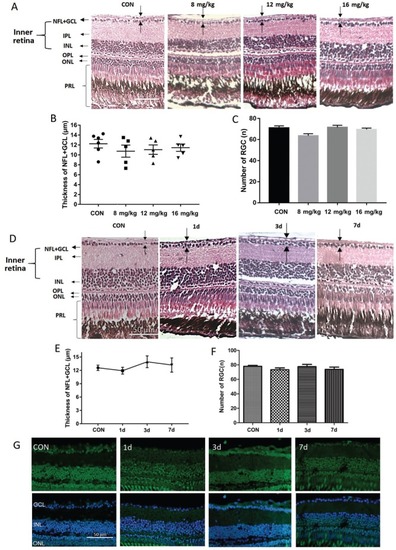
Analysis of intraperitoneal NMDA injection for retinal damage A: H&E staining of paraffin sections (4 µm) from retinas treated intraperitoneally for one day with 10 µL PBS (control) or 8, 12, or 16 mg/kg NMDA; B: The thickness of the NFL+GCL of retinas from each treatment group; C: The retinal ganglion cell number in retinas from each treatment group. Error bars represent standard error of the mean (SEM); n=6 (unpaired t-test showed no significant differences). D: H&E staining of paraffin sections (4 µm) from a control retina treated intraperitoneally with 10 µL PBS for 1d and retinas treated intraperitoneally with 16 mg/kg NMDA for 1, 3, and 7d. The dark arrow points out the thickness of each layer. E: The thickness of the NFL+GCL of retinas from each time point; F: The retinal ganglion cell number in retinas from each time point. Error bars represent standard error of the mean (±SEM); n=6. G: TUNEL staining of retinas from zebrafish treated intraperitoneally with PBS (control) or with 16 mg/kg NMDA for 1, 3, or 7d. Original magnification is 40×. Scale bar, 50 µm. |
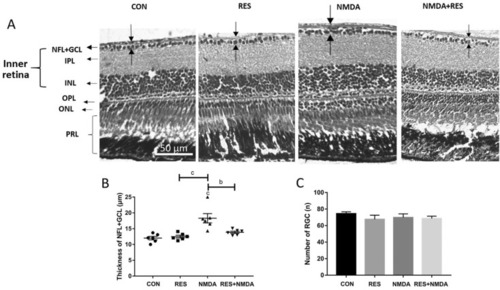
Resveratrol prevents from NMDA-induced thicker NFL A: H&E staining of paraffin sections (4 µm) from representative retinas treated by I.M. in distilled water (control), 50 mg/L resveratrol, 100 µmol/L NMDA, or 50 mg/L resveratrol+100 µmol/L NMDA. The dark arrows point out the thickness of each layer. B: The thickness of the NFL+GCL for each treatment group; C: The retinal ganglion cell number for each treatment group. Error bars represent standard error of the mean (±SEM); n=6 (unpaired t-test, bP<0.01 and cP<0.001). Original magnification is 40×. Scale bar, 50 µm. |
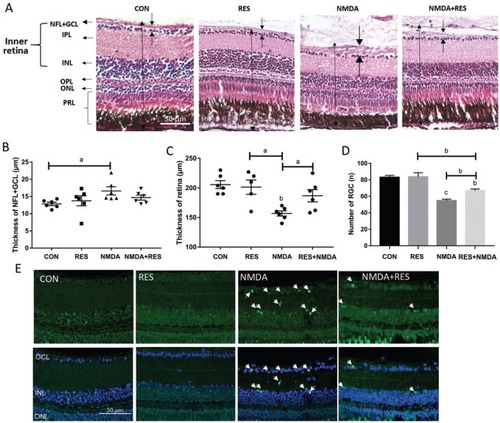
Resveratrol protects against NMDA-induced retinal damage A-E: Zebrafish were treated intravitreally with NMDA and by I.M. in resveratrol. A: H&E staining of paraffin sections (4 µm) from retinas treated with I.V. of 100 nL PBS (control), or 0.5 mol/L NMDA, each plus or minus I.M. in 50 mg/L resveratrol. The dark arrows point out the thickness of each layer. B: The thickness of the NFL+GCL from each treatment group; C: The thickness of the retinas from each treatment group; D: The retinal ganglion cell number from each treatment group. Error bars represent standard error of the mean (SEM); n=6 (unpaired t-test, aP<0.05, bP<0.01, and cP<0.0001 compared with control); E: Representative TUNEL staining images of each treatment group as in A. The white arrows point to apoptotic cells. Original magnification is 40×. Scale bar, 50 µm. |