
Fig. 3
- ID
- ZDB-FIG-191101-16
- Publication
- Luo et al., 2019 - Establishment of an adult zebrafish model of retinal neurodegeneration induced by NMDA
- Other Figures
- All Figure Page
- Back to All Figure Page
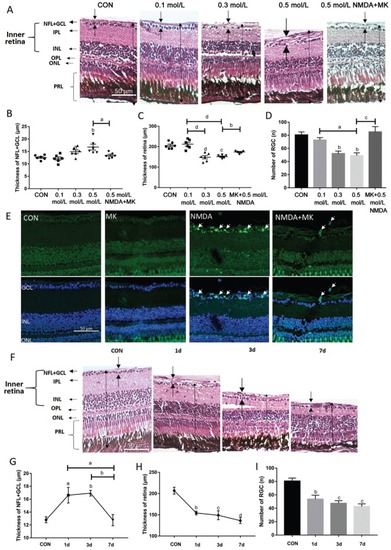
NMDA-induced alterations in retinal histology, thickness and retinal ganglion cell apoptosis A-D: The zebrafish were treated by I.V. of NMDA at different doses for 1d. A: H&E staining of paraffin sections (4 µm) from a control retina treated with 100 nL PBS and retinas treated with 0.1, 0.3, 0.5 mol/L NMDA, and 0.05 mol/L MK-801+0.5 mol/L NMDA. The dark arrows show the thickness of each layer. B: The thickness of the NFL+GCL from different treatment groups; C: The thickness of retinas from different treatment groups; D: The retinal ganglion cell number of retinas from different treatment groups. Error bars represent standard error of the mean (±SEM); n=6 (unpaired t-test, aP<0.05, bP<0.01, cP<0.001, and dP<0.0001 compared with control); E: TUNEL staining of representative control retinas and retinas treated with 50 mmol/L MK-801, 0.5 mol/L NMDA, and MK-801+NMDA. The white arrows point to apoptosis cells. F: H&E staining of paraffin sections (4 µm) from retinas treated intravitreally with 1× PBS (control) or with 0.5 mol/L NMDA for various times; G: The thickness of the NFL+GCL from different treatment groups; H: The thickness of retinas from different treatment groups; I: The retinal ganglion cell number from retinas of different treatment groups. Error bars represent standard error of the mean (±SEM); n=6 (unpaired t-test, aP<0.05, bP<0.01, cP<0.001, and dP<0.0001 compared with control). Original magnification is 40×. Scale bar, 50 µm. |