
Fig. 4
- ID
- ZDB-FIG-191101-15
- Publication
- Luo et al., 2019 - Establishment of an adult zebrafish model of retinal neurodegeneration induced by NMDA
- Other Figures
- All Figure Page
- Back to All Figure Page
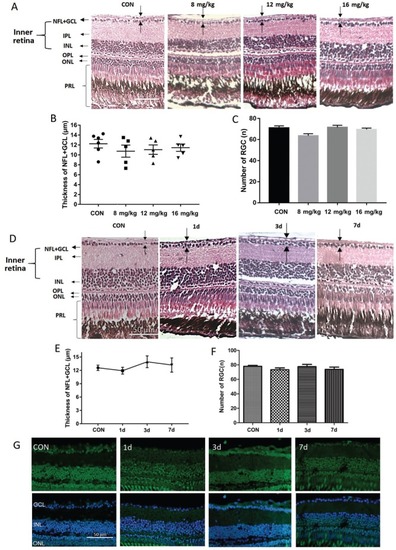
Analysis of intraperitoneal NMDA injection for retinal damage A: H&E staining of paraffin sections (4 µm) from retinas treated intraperitoneally for one day with 10 µL PBS (control) or 8, 12, or 16 mg/kg NMDA; B: The thickness of the NFL+GCL of retinas from each treatment group; C: The retinal ganglion cell number in retinas from each treatment group. Error bars represent standard error of the mean (SEM); n=6 (unpaired t-test showed no significant differences). D: H&E staining of paraffin sections (4 µm) from a control retina treated intraperitoneally with 10 µL PBS for 1d and retinas treated intraperitoneally with 16 mg/kg NMDA for 1, 3, and 7d. The dark arrow points out the thickness of each layer. E: The thickness of the NFL+GCL of retinas from each time point; F: The retinal ganglion cell number in retinas from each time point. Error bars represent standard error of the mean (±SEM); n=6. G: TUNEL staining of retinas from zebrafish treated intraperitoneally with PBS (control) or with 16 mg/kg NMDA for 1, 3, or 7d. Original magnification is 40×. Scale bar, 50 µm. |