
- Title
-
Cardiac neural crest contributes to cardiomyocytes in amniotes and heart regeneration in zebrafish
- Authors
- Tang, W., Martik, M.L., Li, Y., Bronner, M.E.
- Source
- Full text @ Elife
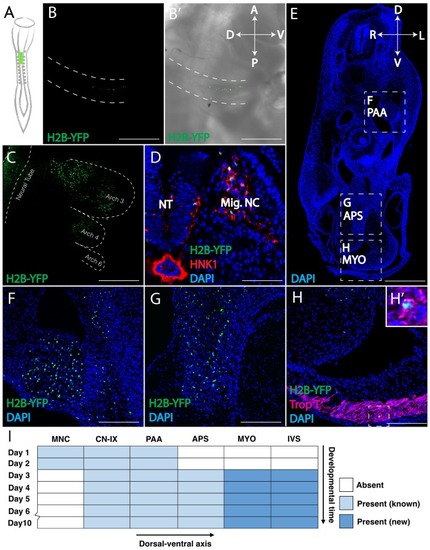
Retrovirally mediated fate mapping of cardiac neural crest reveals novel derivatives. (A) Schematic diagram of the approach: Replication Incompetent Avian (RIA) retrovirus encoding nuclear H2B-YFP was injected into the lumen of the hindbrain from which cardiac neural crest arises. (B) One day post-infection (HH14), whole mount image (lateral view) showing virally labeled progeny (green) in the cardiac migration stream en route to pharyngeal arch 3. (B’) Brightfield image to show anatomical information. A, anterior; P, posterior; D, dorsal; V, ventral. (C) Two days post-infection (HH18), virally labeled cardiac crest has populated pharyngeal arches 3, 4 and 6, highlighted with dashed line. (D) Transverse section showing that labeled cardiac crest expresses neural crest marker HNK-1 (red). D, dorsal; V, ventral; L, left; R, right. (E) Low magnification transverse section of an E6 embryo (DAPI, blue). Dashed boxes show relative positions of cardiac crest-derived populations. (F–H) High magnification image of selected regions in E: pharyngeal arch arteries (F); aorticopulmonary septum (G); Neural crest derivatives located in the outflow tract express Troponin T (magenta), a myocardium marker (H, H’). (I) Temporal map of the establishment of distinct cardiac neural crest derivatives. Labeled cells initially are in the migration stream, cranial nerve IX (CN-IX) and mesenchyme around pharyngeal arch arteries (PAA). Subsequently, they populate the aorticopulmonary septum (APS), myocardium (MYO) and interventricular septum (IVS). Separate channels are displayed in Figure 1—figure supplement 1. Light blue indicates known neural crest derivatives. Dark blue reflects newly discovered neural crest derivatives. Scale bars: B, C, E 400 μm; D, F, G, H 100 μm. |
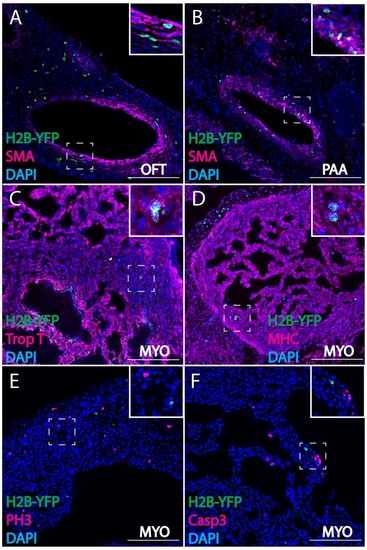
Cardiac crest-derived cells differentiate into smooth muscle and cardiomyocytes in avian embryos. (A, B) Retrovirally labeled cardiac crest cells (H2B-YFP, green) that migrate into the outflow tract (A, OFT) and pharyngeal arch arteries (B) express smooth muscle actin (SMA, magenta) marker. (C, D) Labeled cardiac crest cells that enter the ventricle express myocardial marker Troponin T (magenta) (C), and myocardial terminal differentiation marker Myosin Heavy Chain (MHC, magenta) (D) enclosed in dashed line. (E, F) Neural crest-derived cardiomyocytes are not actively dividing or undergoing apoptosis, as demonstrated by phosphohistone H3 staining (PH3, magenta) (E) and Caspase 3 staining (magenta) (F). Transverse view of E6 embryos. Separate channels are displayed in supplement 1. Scale bars: 100 μm. |
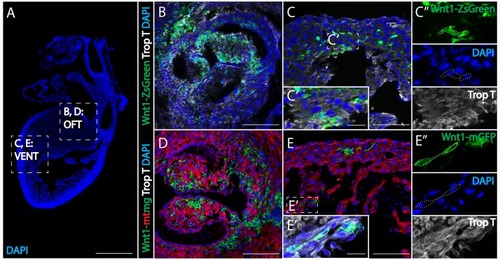
(A) Low magnification image to show the relative anatomical positions of a mouse heart at E15.5 (sagittal view, DAPI-blue). (B, C) In Wnt1-Cre; ZsGreenfl/fl mice, neural crest-derived cells (green, Wnt1-Cre driven ZsGreen expression is abbreviated as Wnt1-ZsGreen, enclosed in dashed line) were observed in myocardium (Troponin T, gray) of the outflow tract (B), and ventricle (VENT) (C, C’’: separate channels of inset C’). (D, E) Similar results were obtained from Wnt1-Cre2+; R26mTmG mice (Wnt1-Cre2+ driven replacement of membrane localized tdTomato (mT) by EGFP (mG) (abbreviated as Wnt1-mtmg), where cardiac crest-derived cells (green, enclosed in dashed line) were present in myocardium of the outflow tract (D) and ventricle (Troponin T, gray) (E, E’’: separate channels of inset E’). Transverse view. Spatial-temporal information and antibody staining are displayed in supplement 1. Scale bars: A 400 μm; B-E 100 μm; C’, E’ 10 μm. |
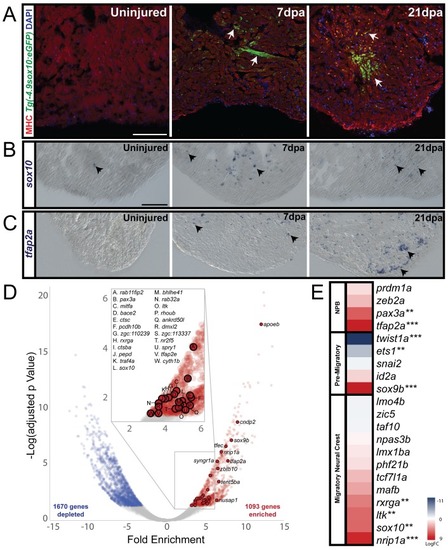
(A) In sham-operated adult zebrafish hearts from a transgenic line expressing GFP under the control of a sox10 promoter, very few cells expressed Tg(−4.9sox10:eGFP) (green) (n = 3). 7 days-post amputation (dpa), the sox10 promoter was reactivated as shown by GFP+ cells in the trabeculated myocardium near the site of injury (Tg(−4.9sox10:eGFP), green) (n = 6). 21dpa, when the resected apex regenerated, more GFP+ cells were observed in sagittal sections within and surrounding the site of injury (n = 6). Sections in A are counterstained with DAPI in blue and Myosin Heavy Chain in red. (B) Endogenous sox10 mRNA expression was observed by paraffin section in situ hybridization in uninjured, 7dpa, and 21dpa hearts. Arrows denote cells with sox10 expression. From these results, we conclude that sox10 is reactivated after injury. (C) Along with sox10, expression of neural crest marker, tfap2a, was also enriched after injury. Arrows label areas of expression in the myocardium. (D) Differential gene expression analysis of FACS-sorted Tg(sox10:mRFP)+ and FACS-sorted Tg(sox10:mRFP)- transcriptomes show n = 1093 genes are enriched at 21dpa in the sox10+ cells compared to the rest of the ventricular tissue (n = 12 ventricles per replicate). Zebrafish neural crest genes as determined by GO analysis are highlighted on the volcano plot. (E) Upregulation of neural crest gene regulatory network genes was also observed from our differential expression analysis (**p<0.05, ***p<0.001). Co-localization of sox10 mRNA expression with Tg(sox10:GAL4-UAS-Cre;ubi:Switch)+ neural crest-derived cardiomyocytes is presented in supplement 1; schematic diagram of experimental design for obtaining the regenerating neural crest transcriptome and further analysis of gene enrichments is presented in supplement 2. Scale bars: 100 μm. |