
Figure 1
- ID
- ZDB-FIG-191230-1812
- Publication
- Tang et al., 2019 - Cardiac neural crest contributes to cardiomyocytes in amniotes and heart regeneration in zebrafish
- Other Figures
- All Figure Page
- Back to All Figure Page
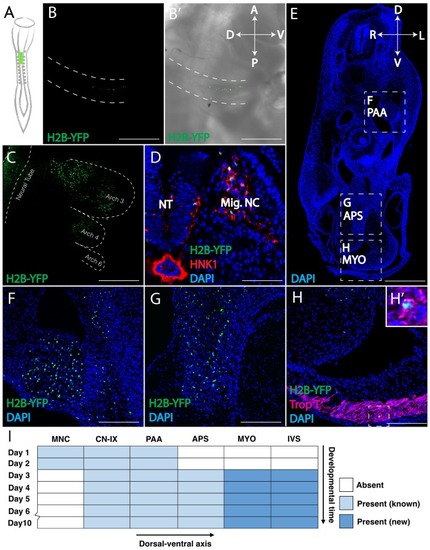
Retrovirally mediated fate mapping of cardiac neural crest reveals novel derivatives. (A) Schematic diagram of the approach: Replication Incompetent Avian (RIA) retrovirus encoding nuclear H2B-YFP was injected into the lumen of the hindbrain from which cardiac neural crest arises. (B) One day post-infection (HH14), whole mount image (lateral view) showing virally labeled progeny (green) in the cardiac migration stream en route to pharyngeal arch 3. (B’) Brightfield image to show anatomical information. A, anterior; P, posterior; D, dorsal; V, ventral. (C) Two days post-infection (HH18), virally labeled cardiac crest has populated pharyngeal arches 3, 4 and 6, highlighted with dashed line. (D) Transverse section showing that labeled cardiac crest expresses neural crest marker HNK-1 (red). D, dorsal; V, ventral; L, left; R, right. (E) Low magnification transverse section of an E6 embryo (DAPI, blue). Dashed boxes show relative positions of cardiac crest-derived populations. (F–H) High magnification image of selected regions in E: pharyngeal arch arteries (F); aorticopulmonary septum (G); Neural crest derivatives located in the outflow tract express Troponin T (magenta), a myocardium marker (H, H’). (I) Temporal map of the establishment of distinct cardiac neural crest derivatives. Labeled cells initially are in the migration stream, cranial nerve IX (CN-IX) and mesenchyme around pharyngeal arch arteries (PAA). Subsequently, they populate the aorticopulmonary septum (APS), myocardium (MYO) and interventricular septum (IVS). Separate channels are displayed in Figure 1—figure supplement 1. Light blue indicates known neural crest derivatives. Dark blue reflects newly discovered neural crest derivatives. Scale bars: B, C, E 400 μm; D, F, G, H 100 μm. |