
Figure 4
- ID
- ZDB-FIG-191230-1818
- Publication
- Tang et al., 2019 - Cardiac neural crest contributes to cardiomyocytes in amniotes and heart regeneration in zebrafish
- Other Figures
- All Figure Page
- Back to All Figure Page
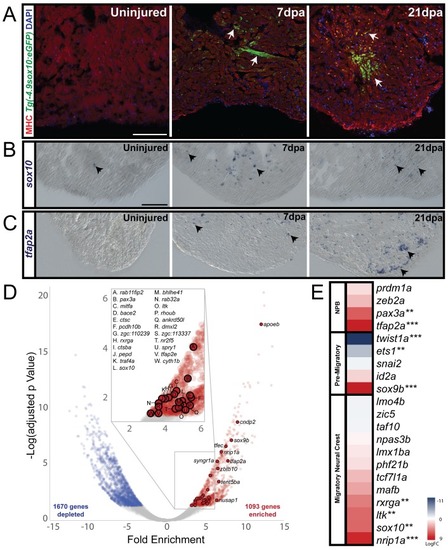
(A) In sham-operated adult zebrafish hearts from a transgenic line expressing GFP under the control of a sox10 promoter, very few cells expressed Tg(−4.9sox10:eGFP) (green) (n = 3). 7 days-post amputation (dpa), the sox10 promoter was reactivated as shown by GFP+ cells in the trabeculated myocardium near the site of injury (Tg(−4.9sox10:eGFP), green) (n = 6). 21dpa, when the resected apex regenerated, more GFP+ cells were observed in sagittal sections within and surrounding the site of injury (n = 6). Sections in A are counterstained with DAPI in blue and Myosin Heavy Chain in red. (B) Endogenous sox10 mRNA expression was observed by paraffin section in situ hybridization in uninjured, 7dpa, and 21dpa hearts. Arrows denote cells with sox10 expression. From these results, we conclude that sox10 is reactivated after injury. (C) Along with sox10, expression of neural crest marker, tfap2a, was also enriched after injury. Arrows label areas of expression in the myocardium. (D) Differential gene expression analysis of FACS-sorted Tg(sox10:mRFP)+ and FACS-sorted Tg(sox10:mRFP)- transcriptomes show n = 1093 genes are enriched at 21dpa in the sox10+ cells compared to the rest of the ventricular tissue (n = 12 ventricles per replicate). Zebrafish neural crest genes as determined by GO analysis are highlighted on the volcano plot. (E) Upregulation of neural crest gene regulatory network genes was also observed from our differential expression analysis (**p<0.05, ***p<0.001). Co-localization of sox10 mRNA expression with Tg(sox10:GAL4-UAS-Cre;ubi:Switch)+ neural crest-derived cardiomyocytes is presented in supplement 1; schematic diagram of experimental design for obtaining the regenerating neural crest transcriptome and further analysis of gene enrichments is presented in supplement 2. Scale bars: 100 μm. |