
- Title
-
Abnormal Behavior of Zebrafish Mutant in Dopamine Transporter Is Rescued by Clozapine
- Authors
- Wang, G., Zhang, G., Li, Z., Fawcett, C.H., Coble, M., Sosa, M.X., Tsai, T., Malesky, K., Thibodeaux, S.J., Zhu, P., Glass, D.J., Fishman, M.C.
- Source
- Full text @ iScience
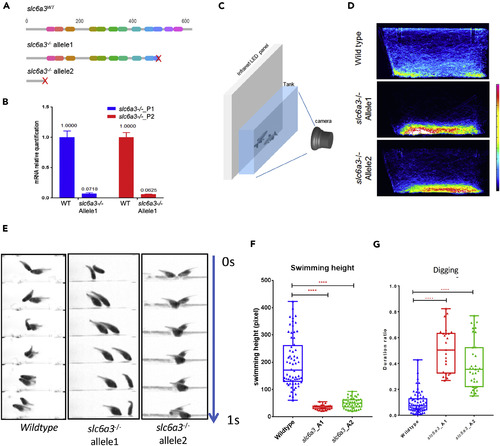
slc6a3 Deficiency Causes Repetitive Behavior (A) The wild-type Slc6a3 protein structure and two different alleles obtained by CRISPR deletions resulting in truncation at different domains in Slc6a3 proteins. (B) qPCR indicating dramatic reduction of slc6a3 truncated mRNA in slc6a3−/− allele1 when compared with the wild-type. (C) The behavior recording system. (D) Heatmaps of fish trajectory of wild-type and two alleles of slc6a3−/− in the home tank in a 30-min video (60 frames per second). The heatmap colors represent frames that fish appear within each 5 × 5-pixel bin in the image (1224 × 500 pixel in 30 min). (E) The “digging” behavior in the slc6a3−/− fish compared with wild-type. All 1-s videos show fish at the tank bottom. Fish bearing both slc6a3−/− alleles display a persistent “digging” behavior, whereas wild-type fish do not. (F) The quantification of average swimming height of fish (nWT = 64, nslc6a3_A1 = 25, nslc6a3_A2 = 40, ****p < 0.0001, significance test: one-way ANOVA Kruskal-Wallis test). (G) The quantification of duration of “digging” feature over the whole 30-min recording time in the tank using Janelia Automatic Animal Behavior Annotator (JABBA) (Kabra et al., 2013) (nWT = 64, nslc6a3_A1 = 25, nslc6a3_A2 = 40, ****p < 0.0001, significance test: one-way ANOVA Kruskal-Wallis test.) See Figure S3 for more details. PHENOTYPE:
|
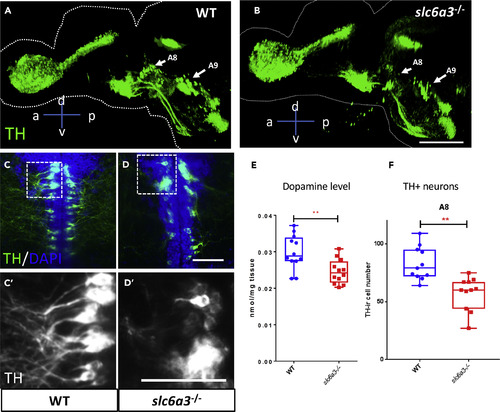
Midbrain Tyrosine Hydroxylase Immunoreactive (TH+) Neurons Degenerate in the slc6a3−/− Fish Brain (A and B) Sagittal view of 3-dimensional rendering of tyrosine hydroxylase (TH) immunostaining of the whole brains of (A) wild-type (WT) and (B) slc6a3−/− allelle1 at 3 months post-fertilization. The arrows indicate two groups of TH+ neurons (A8 and A9 areas) in the midbrain and show reduction in cell numbers in the slc6a3−/− allele1 compared with WT. Scale bar, 400 μm. a, anterior; p, posterior; d, dorsal; v, ventral. (C–E) (C and D) Representative images of TH+ neurons in (C and C′) WT and (D and D′) slc6a3−/− allele1 fish brain in the A8 area at 2 months post-fertilization showing structural changes in neurons and diminution in their arborization. For visualization purpose, images are shown as horizontal ventral views, with anterior on the top. Five optical planes (6-μm interval) were stacked to show the TH+ cells. Scale bar, 20 μm. (E) Mass spectrometry of the dopamine level shows a significant reduction in the slc6a3−/− fish. n = 12 for both WT and slc6a3−/− allele1. **p < 0.01. Significance test: Wilcoxon-Mann-Whitney test. (F) Boxplot shows reduction in cell numbers of A8 TH+ neurons at 2 months post-fertilization. Error bar = standard deviation. n = 11 for both WT and slc6a3−/−allele1. **p < 0.01. Significance test: Wilcoxon-Mann-Whitney test. EXPRESSION / LABELING:
PHENOTYPE:
|
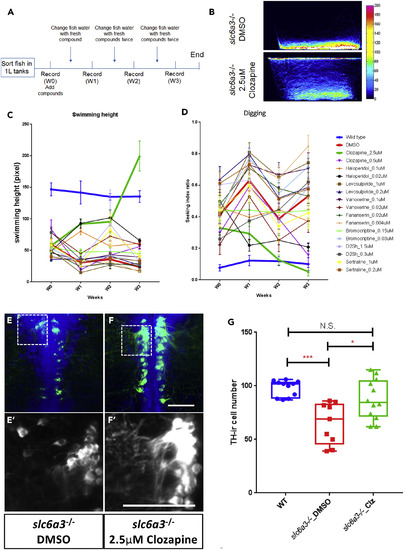
Chronic Clozapine Treatment Rescues Aberrant Swimming Behavior and Midbrain TH+ Neurons in the slc6a3−/− Fish Brain (A) Schematic of the experimental design for chronic treatment of slc6a3−/− allele1 mutant fish with candidate compounds. (B) The heatmap of fish trajectories of control (DMSO) and 2.5 μM clozapine-treated slc6a3−/− allele1 fish after 3 weeks' treatment showing that clozapine reverses aberrant “digging” behavior. (C) Time course of swimming height from week 0 (W0) to week 3 (W3) (n = 5; error bar = standard deviation). (D) The time course of the “digging” feature duration by all compounds over time (n = 5, error bar = standard deviation). (E–F) Representative images of TH+ neurons in (E and E′) DMSO and (F and F′) 2.5 μM clozapine-treated slc6a3−/− allele1 fish brain in the A8 area at 3 months post-fertilization showing restoration of neuronal number and arborization by clozapine. For visualization purpose, images are shown as horizontal ventral views, with anterior on the top. Five optical planes (6-μm interval) were stacked to show the TH+ cells. Scale bar, 20 μm. (G) Boxplot shows clozapine-induced restoration of TH-immunoreactive A8 cell number in slc6a3−/− allele1 fish at 3 months post-fertilization. (For all, n ≥10. Error bar = standard deviation. ***p < 0.001, *p < 0.05. N.S., no significance. Significance test: one-way ANOVA Kruskal-Wallis test). |
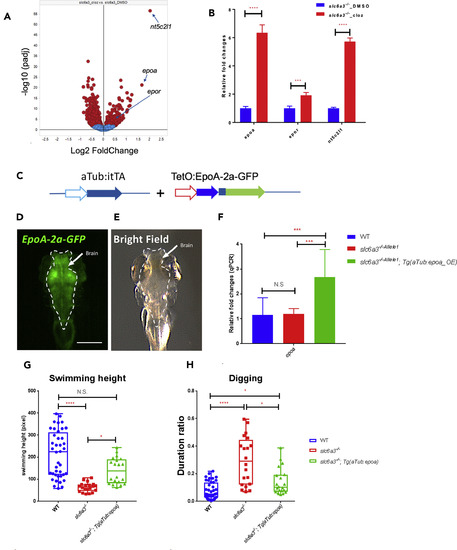
RNA-Seq Analysis Reveals Erythropoietin Pathway as a Potential Clozapine Target (A) The volcano plot of log2-fold change of gene expression in the adult fish brain between the treatments of clozapine and DMSO in slc6a3−/− allele1. The clozapine highly upregulated genes (epoa, epor, and nt5c2l1) are indicated on the graph. (B) Bar plot of gene expression of epoa, epor, and nt5c2l1 by RNA-seq analysis. ****p < 0.0001, ***p < 0.001. n = 8 for all. Error bar = standard deviation. Significance test: Wilcoxon-Mann-Whitney test. (C) The construct maps for over-expression of epoa in neurons with the tetracycline-controlled transcriptional activation system. (D and E) The dorsal view of the green channel (D) and bright field (E) of a slc6a3−/−_allele1; Tg(aTub:iTTA; TetO:EpoA-2a-GFP) fish at 5 days post-fertilization under a fluorescent dissecting microscope. The brain area (indicated by green fluorescence in D) is outlined by a dotted line. Scale bar, 250 μm. (F) Whole-brain qRT-PCR at 2 months post-fertilization confirms the upregulation of epoa in the slc6a3−/−_allele1;Tg(aTub:iTTA; TetO:EpoA-2a-GFP) fish. Error bar, standard deviation. n = 6 for all conditions. ***p < 0.001, **p < 0.01, N.S., no significance. Significance test, Wilcoxon-Mann-Whitney test. (G and H) The quantification of The quantification of average swimming height (G) and duration of “digging” feature (H) of slc6a3−/−_allele1; Tg(aTub:iTTA; TetO:EpoA-2a-GFP) compared to slc6a3−/−_allele1 and wild-type at 2 months post-fertilization. nWT = 40, nslc6a3−/−_allele1_ = 20, nslc6a3−/−_allele1; tg(aTub:eopa) = 20. ∗∗∗∗p < 0.0001, ∗p < 0.05, N.S., no significance. Significance test: one-way ANOVA Kruskal-Wallis test. EXPRESSION / LABELING:
PHENOTYPE:
|
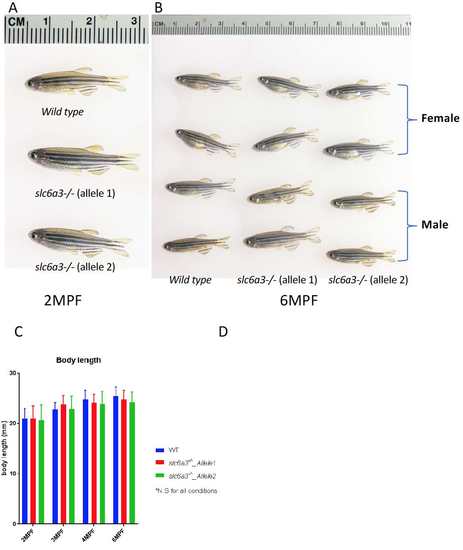
slc6a3 knockout does not affect overall morphology and development, related to Figure 1. (A) Zebrafish images of WT, slc6a3-/- allele1, and slc6a3-/- allele2 at 2 months post-fertilization (2mpf). It should be noted that fish do not show gender related morphology yet at this stage. (B) Zebrafish images of wild-type (WT), slc6a3-/- allele1, and slc6a3-/- allele2 at 6 months post-fertilization (6mpf). (C) Fish body length (head to tail) measurement of WT, slc6a3-/- allele1, and slc6a3-/- allele2 at 2mpf, 3mpf, 4mpf, and 6mpf. For all n>=16, significance test: one-way ANOVA Kruskal-Wallis test. |
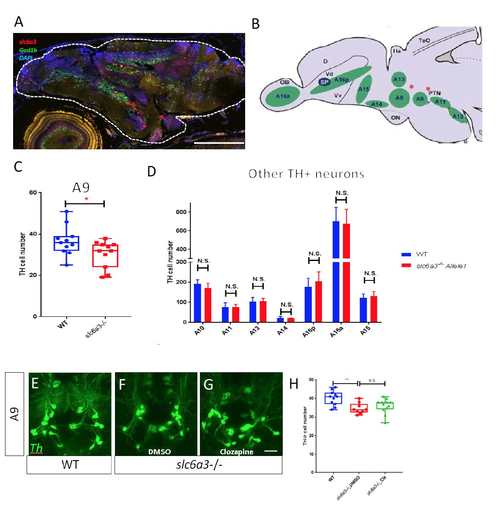
Whole brain CUBIC clearing to visualize TH+ neurons in the adult brain, related to Figure 2 and Figure 3. (A) RNAscope confirms expression of slc6a3 expression in the zebrafish brain. gad1b is a marker of brain glutamatergic neurons and used as a reference of brain areas. Scale bar=250μm (B) Diagram of location of TH+ neuron groups (dark green) in the zebrafish brain, in a sagittal view. D, dorsal telencephalic area; Ha, habenula; OB, olfactory bulb; ON, optic nerve; PTN, posterior tuberculum; Vd, dorsal telencephalic area; Vv, ventral telencephalic area; TeO, optic tectum; SP, Subpalium. (Parker et al., 2013) (C) slc6a3-/- allele1 fish manifest slight reduction of A9 DA neuron numbers at 2mpf. Box plot of cell numbers of A9 neurons are shown. Error bar=standard deviation. n=11 for both WT and slc6a3-/- allele1. *p<0.05. Significance test: Wilcoxon–81 Mann–Whitney test. (D) TH+ neuronal number is unaffected in other regions of the slc6a3-/- allele1 brain. Error bar=standard deviation. N>=8 for both WT and slc6a3-/- allele1 conditions. N.S.=no significance. Significance test: Wilcoxon–Mann–Whitney test. (E-H) 2.5uM clozapine treatment does not significantly rescue the A9 cell number in slc6a3-/- allele1. (E-G) Representative images of A9 neurons by z-projection of A9 neuron images. Scale bar=10μm. (H) Box plot of A9 DA cell number in wild-type, DMSO and 2.5uM clozapine treated slc6a3-/- allele1 at 3mpf. For all n>=12. Error bar=standard deviation. **p<0.01. N.S.=no significance. Significance test: one way ANOVA Kruskal-Wallis test. |