
Fig. 2
- ID
- ZDB-IMAGE-190909-13
- Antibodies
- Publication
- Wang et al., 2019 - Abnormal Behavior of Zebrafish Mutant in Dopamine Transporter Is Rescued by Clozapine
- All Figures
- Figures for Wang et al., 2019
|
Fig. 2
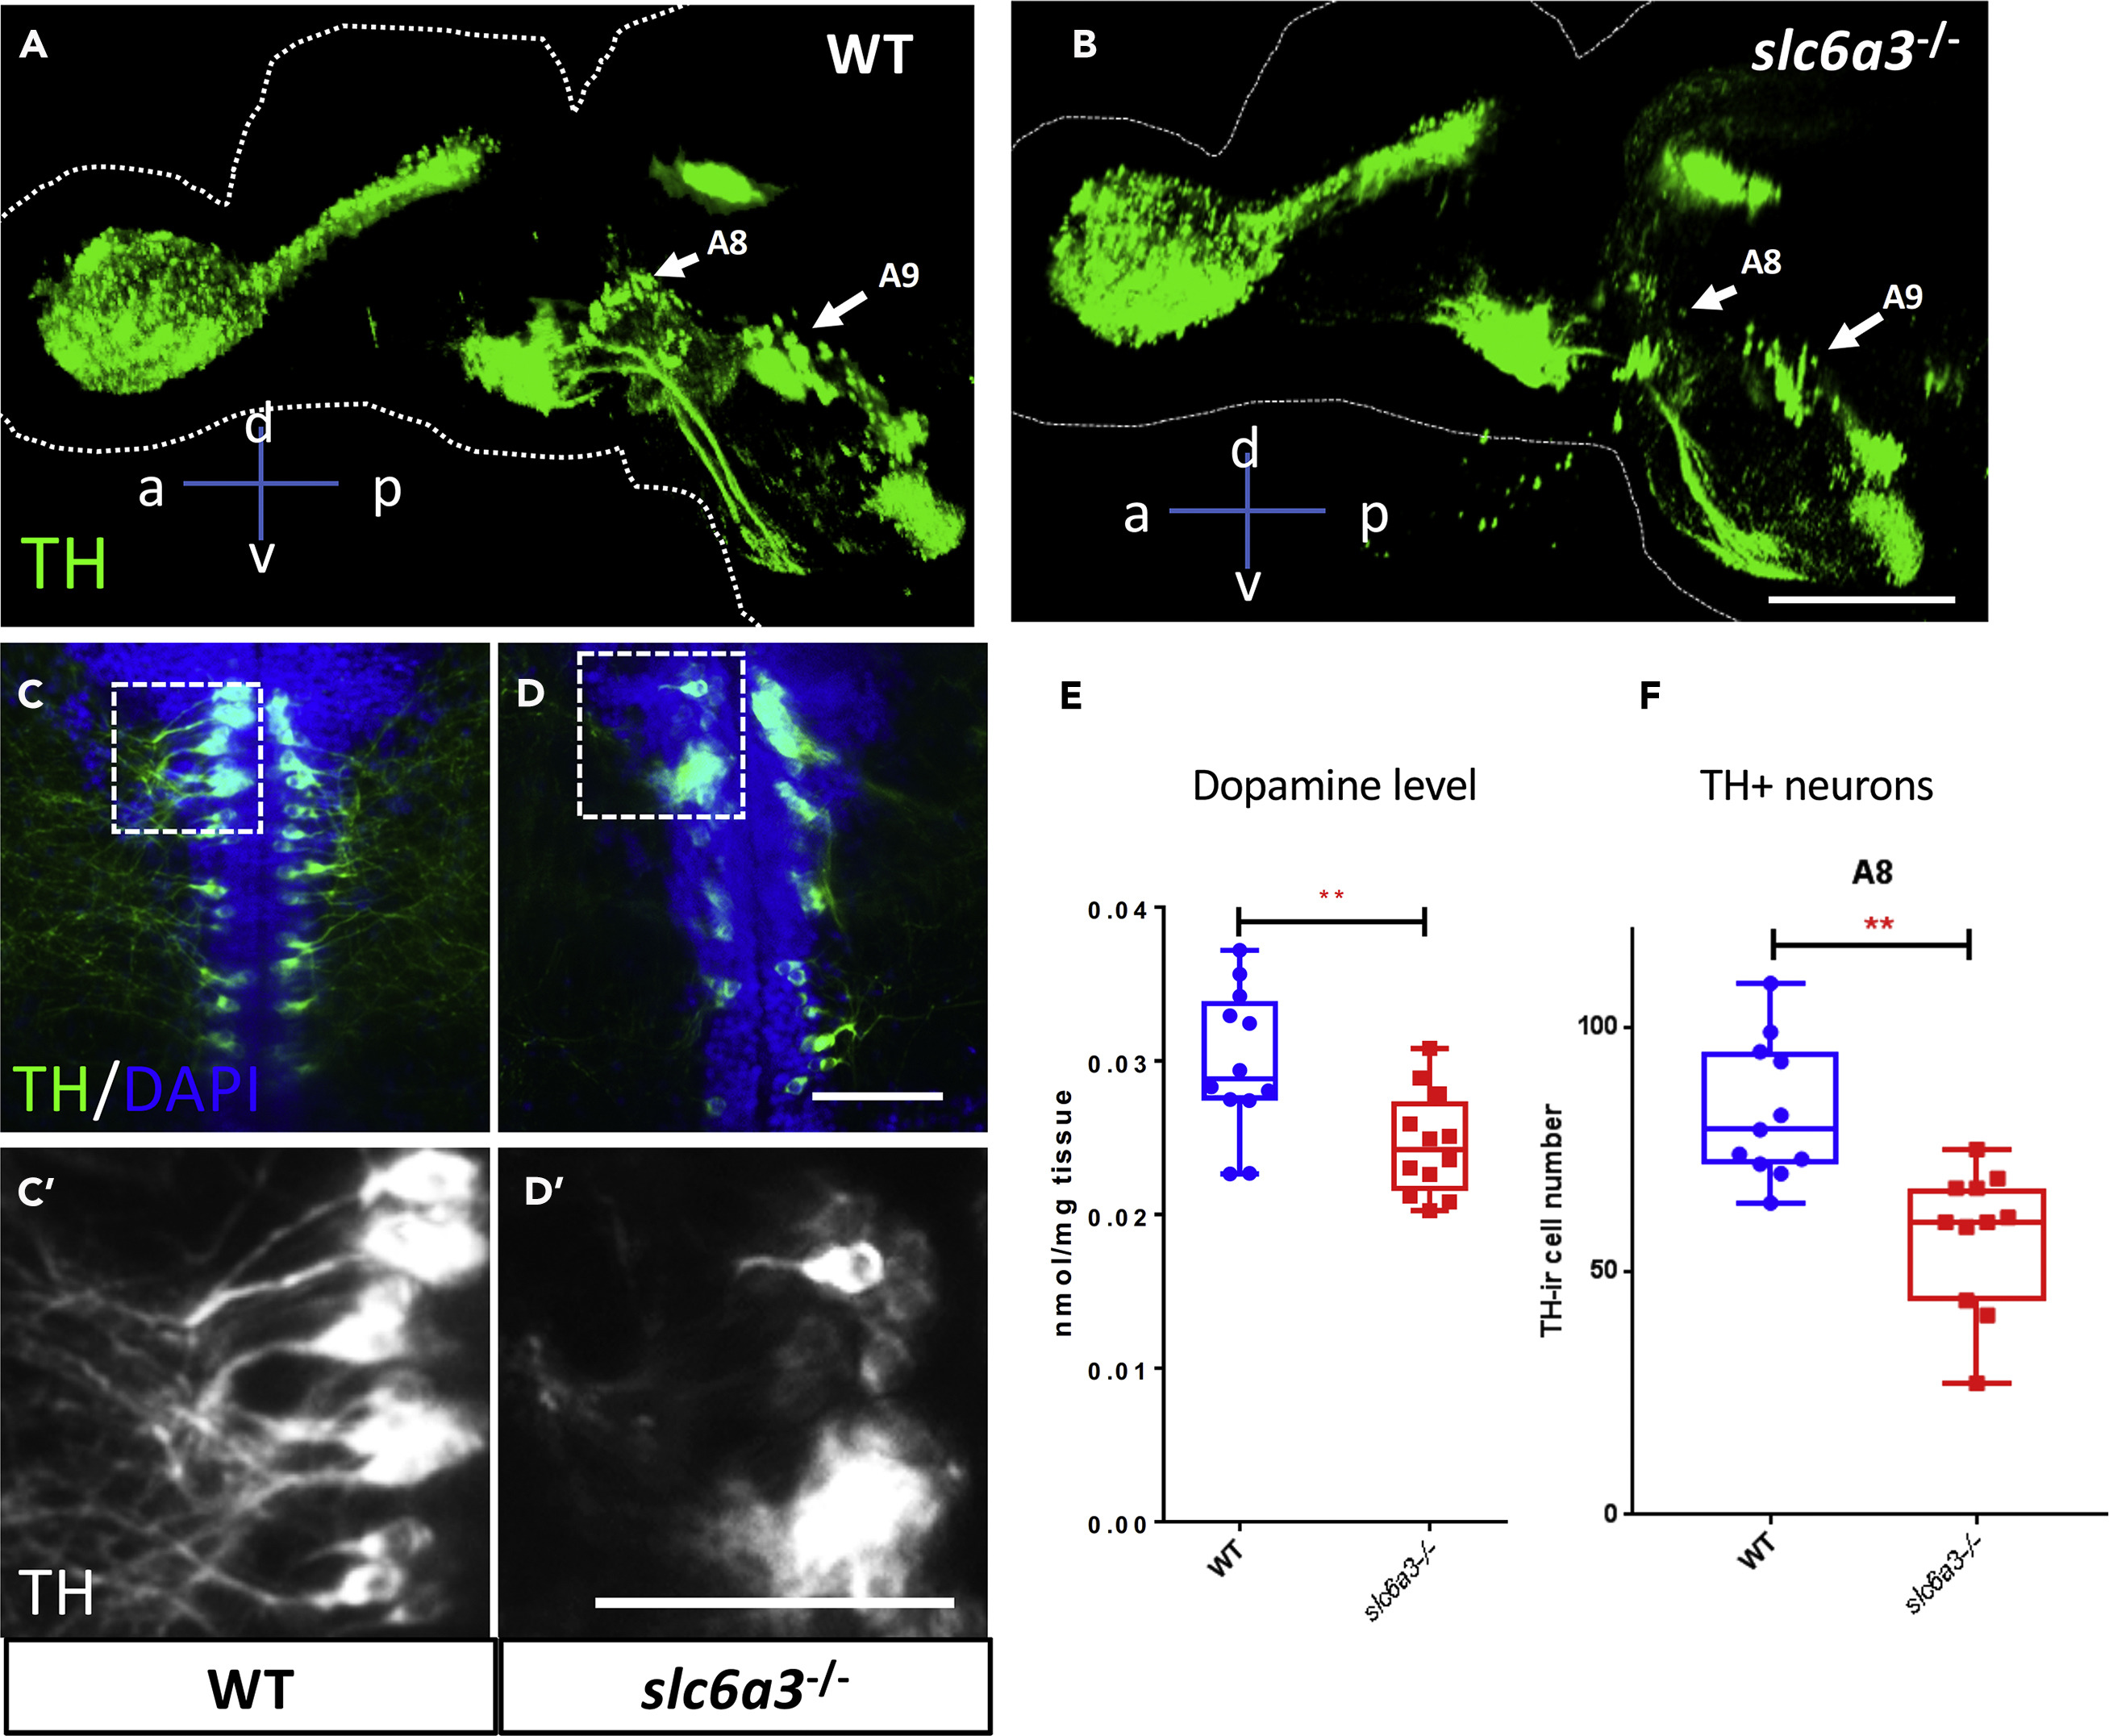
Midbrain Tyrosine Hydroxylase Immunoreactive (TH+) Neurons Degenerate in the slc6a3−/− Fish Brain
(A and B) Sagittal view of 3-dimensional rendering of tyrosine hydroxylase (TH) immunostaining of the whole brains of (A) wild-type (WT) and (B) slc6a3−/− allelle1 at 3 months post-fertilization. The arrows indicate two groups of TH+ neurons (A8 and A9 areas) in the midbrain and show reduction in cell numbers in the slc6a3−/− allele1 compared with WT. Scale bar, 400 μm. a, anterior; p, posterior; d, dorsal; v, ventral.
(C–E) (C and D) Representative images of TH+ neurons in (C and C′) WT and (D and D′) slc6a3−/− allele1 fish brain in the A8 area at 2 months post-fertilization showing structural changes in neurons and diminution in their arborization. For visualization purpose, images are shown as horizontal ventral views, with anterior on the top. Five optical planes (6-μm interval) were stacked to show the TH+ cells. Scale bar, 20 μm. (E) Mass spectrometry of the dopamine level shows a significant reduction in the slc6a3−/− fish. n = 12 for both WT and slc6a3−/− allele1. **p < 0.01. Significance test: Wilcoxon-Mann-Whitney test.
(F) Boxplot shows reduction in cell numbers of A8 TH+ neurons at 2 months post-fertilization.
Error bar = standard deviation. n = 11 for both WT and slc6a3−/−allele1. **p < 0.01. Significance test: Wilcoxon-Mann-Whitney test.