FIGURE SUMMARY
Title

Ecotoxicity Assessment of Fe3O4 Magnetic Nanoparticle Exposure in Adult Zebrafish at an Environmental Pertinent Concentration by Behavioral and Biochemical Testing

Authors
Malhotra, N., Chen, J.R., Sarasamma, S., Audira, G., Siregar, P., Liang, S.T., Lai, Y.H., Lin, G.M., Ger, T.R., Hsiao, C.D.
Source
Full text @ Nanomaterials (Basel)

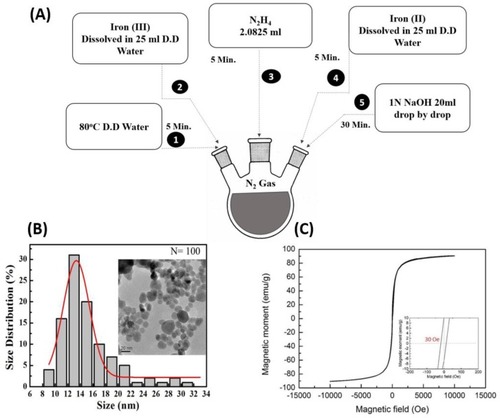
Physical property characterization of Fe3O4 magnetic nanoparticles (MNPs) used in this study. (A) Schematic diagram showing the protocol and process for MNPs synthesis. (B) Transmission electron microscopy (TEM) examination of the size distribution of the MNPs. Insert: showing the Fe3O4 MNPs particle size and shape under TEM (scale bar = 20 μm). (C) Hysteresis curve of the MNPs measured by superconducting quantum interference device (SQUID) magnetometry. Insert: showing the calculated magnetic field of the synthesized Fe3O4 MNPs.

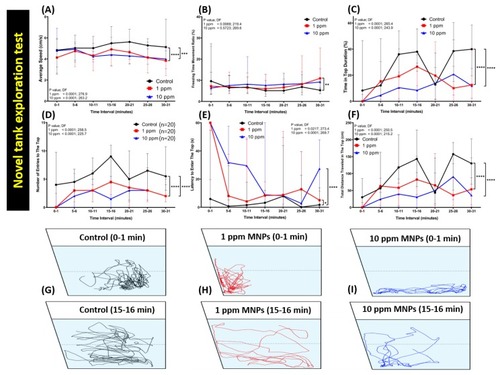
Behavior endpoint of control and Fe3O4 MNPs-exposed zebrafish in novel tank exploration test after two weeks’ exposure. (A) Average speed, (B) freezing time movement ratio, (C) time in top duration, (D) number of entries to the top, (E) latency to enter the top, and (F) total distance traveled in the top were analyzed. (G–I) The locomotion trajectories of control as well as 1 and 10 ppm MNPs-exposed fish in the novel tank test. The black line represents the control group, the red line represents the low concentration MNPs group (1 ppm), and the blue line represents the high concentration MNPs group (10 ppm). The data are expressed as the median with interquartile range and were analyzed by two-way ANOVA with Geisser-Greenhouse correction. To observe the main column (Fe3O4 MNPs) effect, Dunnett’s multiple comparison test was carried out. (n = 20, * p < 0.05, ** p < 0.01, *** p < 0.005, **** p < 0.001).

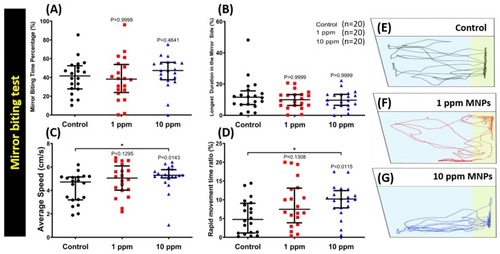
Mirror biting behavior endpoint comparisons between the control group, 1 ppm, and 10 ppm Fe3O4 MNPs-exposed zebrafish groups after two weeks of exposure. (A) Mirror biting time percentage, (B) longest duration in the mirror side, (C) average speed, and (D) the rapid time movement ratio were analyzed. The locomotion trajectories of control, 1, and 10 ppm MNPs-exposed fish in the mirror biting test were presented in (EG), respectively. The data are expressed as the median with interquartile range and were analyzed by the Kruskal-Wallis test continued with Dunn’s multiple comparisons test as a follow-up test (n = 20, * p < 0.05).

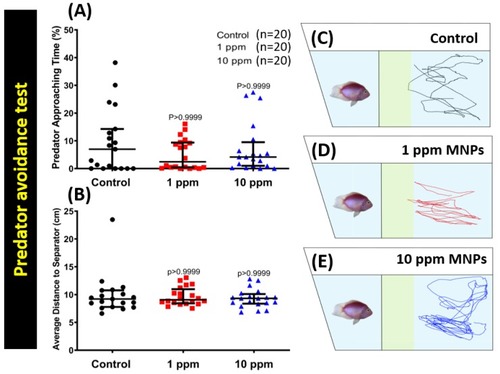
Predator avoidance behavior endpoint comparisons between control, 1 ppm, and 10 ppm Fe3O4 MNPs-exposed zebrafish groups after two weeks of exposure. (A) Predator approaching time percentage and (B) average distance to the separator were analyzed. The locomotion trajectories for the control, 1 ppm, and 10 ppm MNPs exposed fish in the predator avoidance test were presented in (CE), respectively. The data are expressed as the median with interquartile range and were analyzed by the Kruskal-Wallis test with Dunn’s multiple comparisons test as a follow-up test (n = 19 for the control group, n = 20 for 1 ppm MNPs-exposed group, and n = 20 for 10 ppm MNPs exposed group).

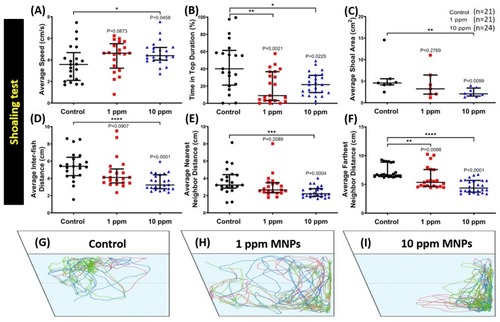
Shoaling behavior endpoint comparisons between the control group, 1 ppm, and 10 ppm Fe3O4 MNPs-exposed zebrafish groups after two weeks of exposure. (A) Average speed, (B) time in the top duration, (C) average shoal area, (D) average inter-fish distance, (E) average nearest neighbor distance, and (F) average furthest neighbor distance were analyzed. (G–I) The locomotion trajectories for the control, 1 ppm and 10 ppm MNPs exposed fish in the shoaling test. Groups of three fish were tested for shoaling behavior. The data are expressed as the median with interquartile range and were analyzed by the Kruskal-Wallis test, which continued with Dunn’s multiple comparisons test as a follow-up test (n = 21 for the control group and 1 ppm MNPs-exposed group, n = 24 for 10 ppm MNPs, * p < 0.05, ** p< 0.01, *** p < 0.001, and **** p < 0.0001).

Behavior endpoint comparisons between the control group, 1 ppm, and 10 ppm Fe3O4 MNPs-exposed zebrafish groups after two weeks of exposure. (A) Interaction time percentage, (B) longest duration in the separator side, (C) average speed, and (D) average distance to the separator were analyzed. (E–G) The locomotion trajectories for the control, 1, and 10 ppm MNPs-exposed fish in the conspecific social interaction test. The data are expressed as the median with an interquartile range and were analyzed by the Kruskal-Wallis test, which continued with Dunn’s multiple comparisons test as a follow-up test (n = 20, * p < 0.05, ** p < 0.01).

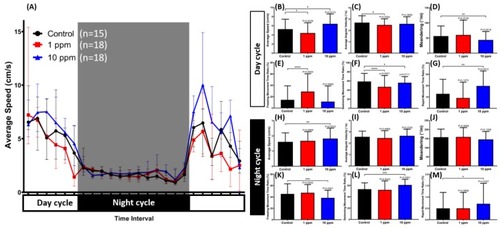
The circadian rhythm assay for Fe3O4 MNPs-exposed zebrafish after 14-day exposure. (A) Comparison of chronological changes of the average speed in light and dark cycles. The grey area shows the dark period while the white area shows the light period. Comparison of the (B) average speed, (C) average angular velocity, (D) meandering, (E) freezing movement time ratio, (F) swimming movement time ratio, and (G) rapid movement time ratio at the light cycle. Comparison of the (H) average speed, (I) average angular velocity, (J) meandering, (K) freezing movement time ratio, (L) swimming movement time ratio, and (M) rapid movement time ratio during the dark cycle. The data are expressed as the median with an interquartile range and were analyzed by a Kruskal-Wallis test, which continued with Dunn’s multiple comparisons test as a follow-up test (n = 15 for control, n = 18 for 1 and 10 ppm MNPs-exposed group, * p < 0.05, ** p < 0.01, *** p < 0.001, **** p < 0.0001).

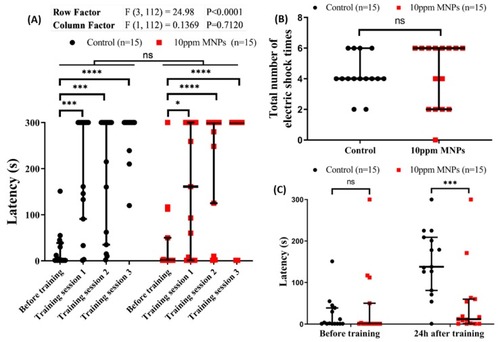
Passive avoidance test on zebrafish after 14 days of Fe3O4 MNPs exposure to evaluate short-term memory. (A) The latency of control (black) and MNPs-exposed (red) group in the dark chamber with electric shock punishment before and during training. (B) Total number of electric shocks given to zebrafish until passing the training session. (C) The latency of control (black) and MNPs-exposed (red) groups in the dark chamber with electric shock punishment before and one day after a training session. The data are expressed as the median with an interquartile range and significance were analyzed by a two-way ANOVA test (n = 15, * p < 0.05, *** p < 0.001, **** p < 0.0001).

Acknowledgments
This image is the copyrighted work of the attributed author or publisher, and ZFIN has permission only to display this image to its users. Additional permissions should be obtained from the applicable author or publisher of the image. Full text @ Nanomaterials (Basel)